📊 Recent Price Snapshot
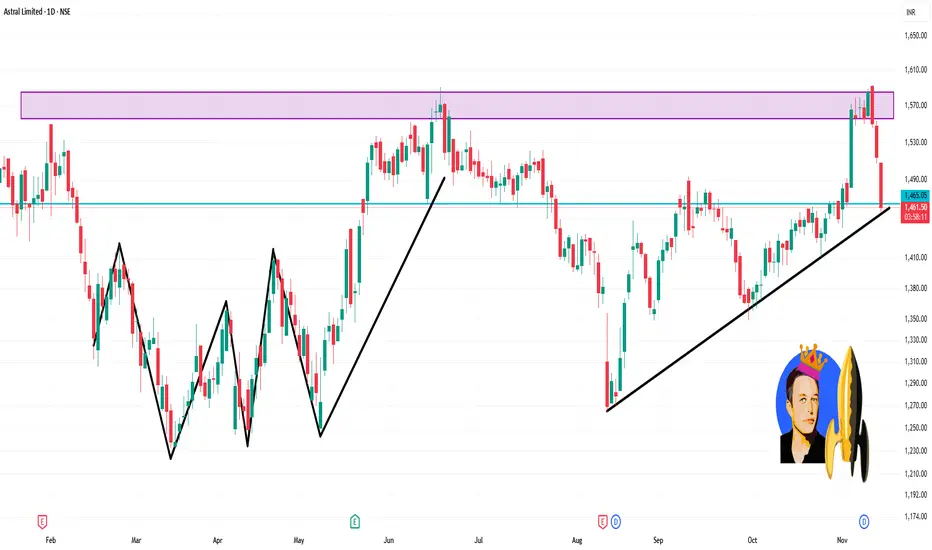
Latest closing around ₹1,460-₹1,470.
Daily range on latest day: High ~ ₹1,508, Low ~ ₹1,460.
52 week high ~ ₹1,867, 52 week low ~ ₹1,232.
🔍 Key Levels for the 1-Day Timeframe
Support Levels
Around ₹1,440–₹1,450: Recent lows touched ~1,445.
Further support nearer the 200-day SMA (~₹1,417) as per technical data.
Resistance Levels
Immediate resistance near ₹1,508 (recent high).
A stronger resistance zone around ₹1,520-₹1,550 (recent swing highs).
Price Action & Trend
The stock is trading above its 200-day average (~₹1,417) but the upward momentum appears weak.
On short term RSI/MFI metrics: MFI appears elevated (suggestive of some overbought behaviour).
相关出版物
免责声明
这些信息和出版物并非旨在提供,也不构成TradingView提供或认可的任何形式的财务、投资、交易或其他类型的建议或推荐。请阅读使用条款了解更多信息。