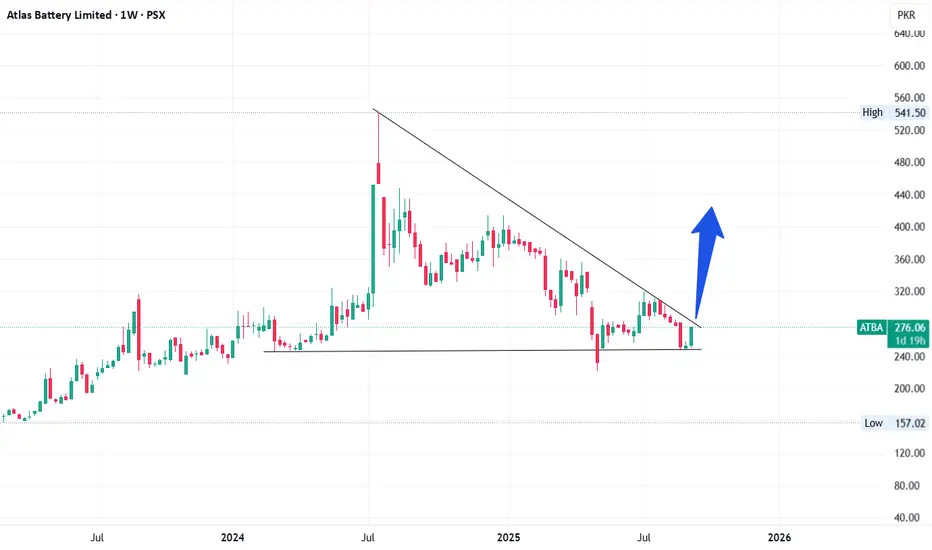
ATBA is currently taking trendline resistance as shown in chart. Once broken (weekly closing above 287), it will bounce back to its recent high (~450).
On weekly timeframe, a falling wedge pattern can be observed which is a bullish pattern.
Bad result in recent quarter may cause this trendline resistance to be a tough task to break. However, on a bigger (monthly) timeframe, a beautiful inverse head and shoulder is forming that may take its effect in coming months.
This is not a buy / sell call, be cautious while investing in fundamentally weak stocks.
Keep your stoploss at 221 (Recent low on May 7th).
免责声明
这些信息和出版物并不意味着也不构成TradingView提供或认可的金融、投资、交易或其它类型的建议或背书。请在使用条款阅读更多信息。
免责声明
这些信息和出版物并不意味着也不构成TradingView提供或认可的金融、投资、交易或其它类型的建议或背书。请在使用条款阅读更多信息。