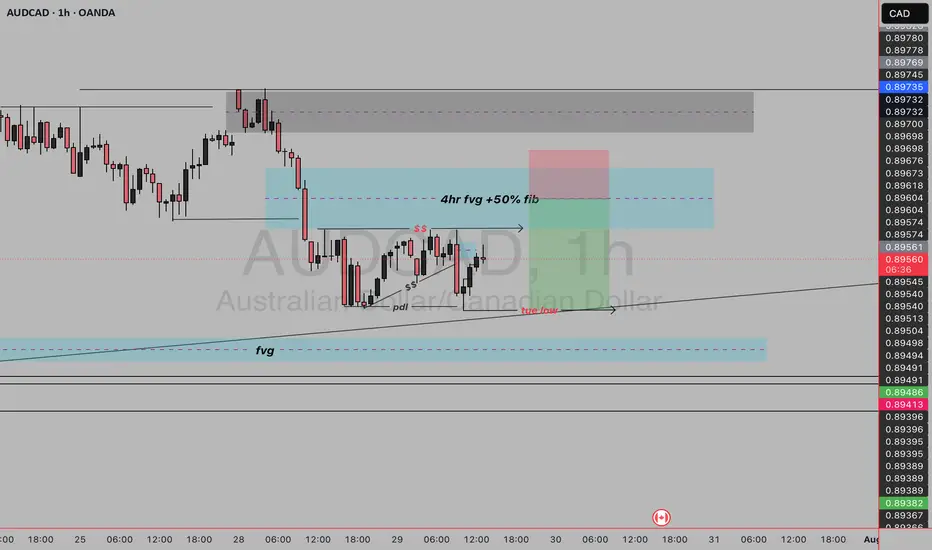
This AUD/CAD H1 chart shows a Smart Money Concept (SMC) based sell setup, focused on liquidity engineering, internal structure shifts, and supply zone rejections.
Key Features of the Sell Setup
1. Break of Market Structure
Price previously rallied and made a high at 0.90140.
After that, there was a clear break of structure to the downside with strong bearish candles—indicating distribution and a bearish order flow shift.
2. Premium Supply Zone (Blue Box)
The price is retracing back into a supply zone, where institutional orders previously caused the strong drop.
The blue zone marks a bearish Order Block or supply area where price is expected to react.
Your entry is placed just below this zone.
3. Equal Highs / Liquidity Above
Multiple internal highs were created (marked with $$)—these are liquidity traps.
Price is likely to grab liquidity above these highs before rejecting from the supply zone.
4. Entry Context
Sell entry is placed after a liquidity sweep above minor internal highs.
The Current High (crt high) marks the point of internal liquidity.
This entry is anticipating a rejection from this area (above previous highs but below the OB's top).
5. Fair Value Gap (fvg)
A clear FVG exists below current price—this is your downside magnet or target area.
Price often fills FVGs after mitigation of supply/demand.
6. Stop Loss & Take Profit
Stop Loss (red box): Placed above the supply zone and liquidity grab area, protecting from deeper retracements.
Take Profit (green box): Aiming toward the FVG zone and unfilled imbalance near 0.89430–0.89390.
Why This Is a Valid Sell Setup
Break of Bullish Structure (Shift in Order Flow).
Liquidity Sweeps above equal highs.
Retracement into Supply Zone / Premium.
Confluence with FVG below for target
免责声明
这些信息和出版物并不意味着也不构成TradingView提供或认可的金融、投资、交易或其它类型的建议或背书。请在使用条款阅读更多信息。
免责声明
这些信息和出版物并不意味着也不构成TradingView提供或认可的金融、投资、交易或其它类型的建议或背书。请在使用条款阅读更多信息。