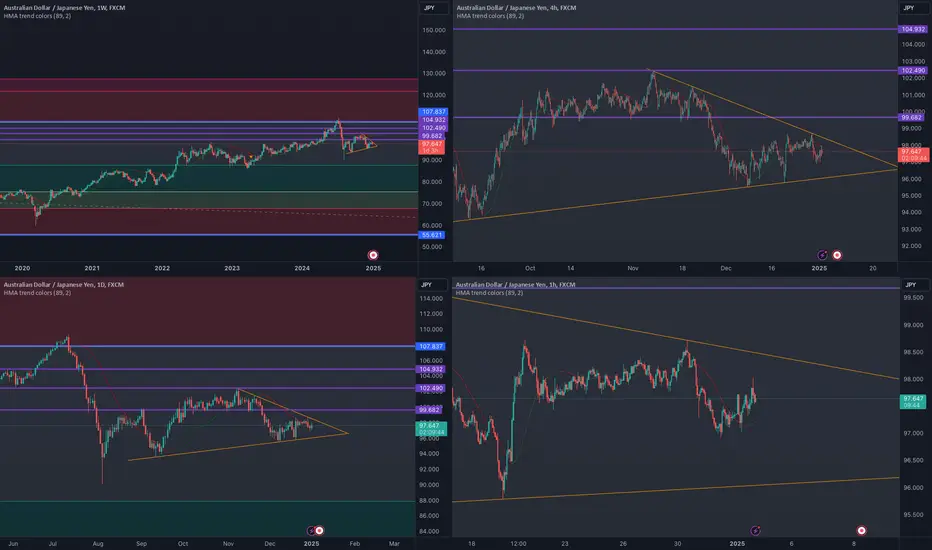
A perfect triangle has taken shape in the #AUDJPY chart touching laser sharp on all major candles across multiple timeframes. I first saw this on the 4H chart but it immediately became clear it was clean in all timeframes, with support going even going back to september last year!
This is a very choppy chart, so will wait for breakout in either direction to put a trade on. I could add that the HMA is bearish in all but the lower 1H timeframe, but in this case that gives me no extra information.
Given the significance of this triangle in terms of form and duration, one can expect a large move after breakout. If the breakout about to occur is bullish I will build a position towards the different resistance levels up to the 107.8 region, that is equivalent to 1000 pips! Will take profits along the way, of course.
If bearish, the potential is even greater, targeting first major support in the 88 region with stops along the way, mainly the bottom of the huge pin bar of the 5th August slightly above 90.
免责声明
这些信息和出版物并非旨在提供,也不构成TradingView提供或认可的任何形式的财务、投资、交易或其他类型的建议或推荐。请阅读使用条款了解更多信息。