Weekly Overview:
Price is holding well at a key weekly support zone, forming a strong rejection candle—indicating buyer interest stepping in at this level.
Daily Chart:
We are seeing consistent bullish pressure with four consecutive bullish candles. This is a good sign that momentum is building on the buy side.
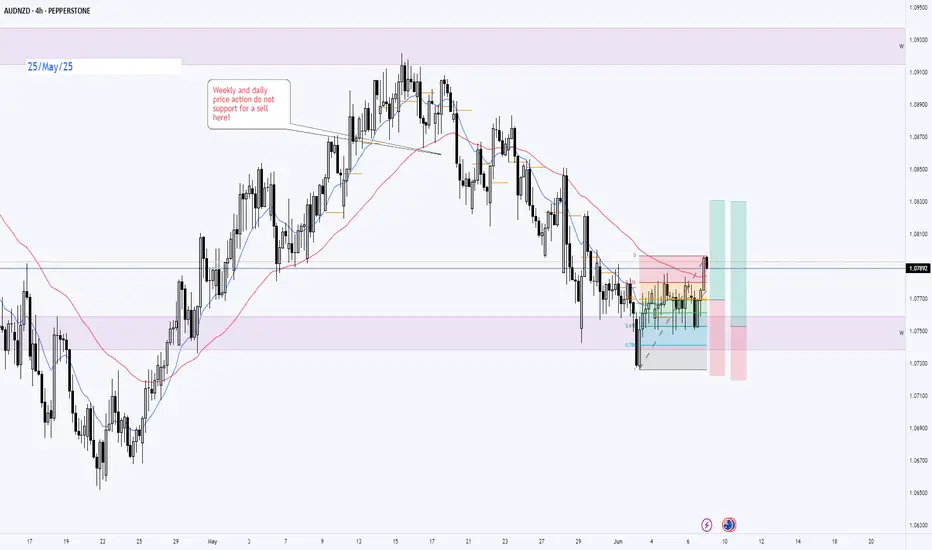
4H Chart:
Price action has decisively broken the downtrend line, pierced above minor resistance levels, and successfully cleared the 50EMA—confirming a potential shift to bullish structure. 📈
Plan:
🔹 Bias: Bullish
🔹 Entry: Wait for retracement to discounted zone or confirmation candle above broken resistance
🔹 Targets:
‣ TP1: Previous 4H high
‣ TP2: Daily resistance zone
🔹 Invalidation: A break back below the 4H 50EMA and trendline support
Price is holding well at a key weekly support zone, forming a strong rejection candle—indicating buyer interest stepping in at this level.
Daily Chart:
We are seeing consistent bullish pressure with four consecutive bullish candles. This is a good sign that momentum is building on the buy side.
4H Chart:
Price action has decisively broken the downtrend line, pierced above minor resistance levels, and successfully cleared the 50EMA—confirming a potential shift to bullish structure. 📈
Plan:
🔹 Bias: Bullish
🔹 Entry: Wait for retracement to discounted zone or confirmation candle above broken resistance
🔹 Targets:
‣ TP1: Previous 4H high
‣ TP2: Daily resistance zone
🔹 Invalidation: A break back below the 4H 50EMA and trendline support
交易结束:到达目标
TPs hit免责声明
这些信息和出版物并不意味着也不构成TradingView提供或认可的金融、投资、交易或其它类型的建议或背书。请在使用条款阅读更多信息。
免责声明
这些信息和出版物并不意味着也不构成TradingView提供或认可的金融、投资、交易或其它类型的建议或背书。请在使用条款阅读更多信息。