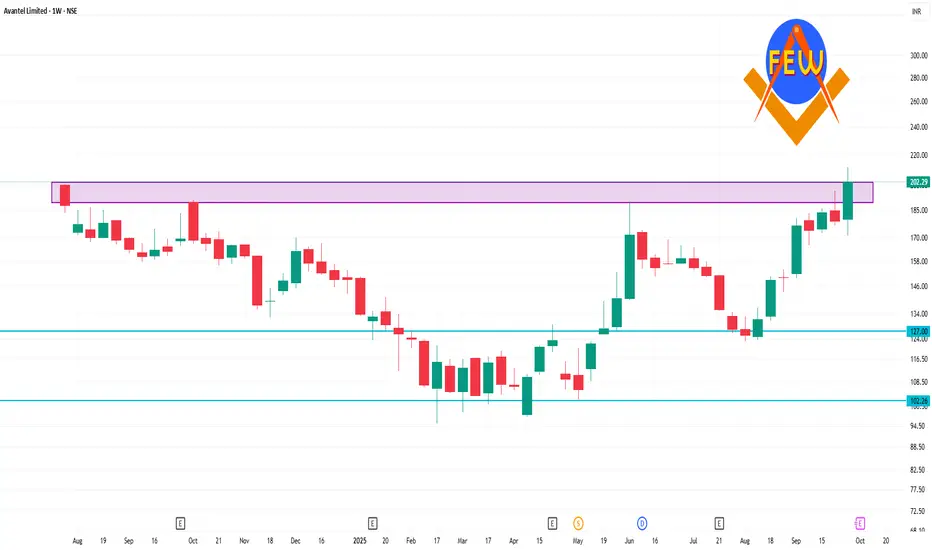
📈 Price Performance (1 Week)
Current Price: ₹202.29
Weekly Change: +11.61%
52-Week Range: ₹95.51 – ₹211.79
📊 Technical Indicators
Moving Averages
20-Day EMA: ₹173.47
50-Day EMA: ₹160.46
100-Day EMA: ₹151.62
200-Day EMA: ₹144.58
Current Price vs. EMAs: The current price is above all major EMAs, indicating a bullish trend.
Relative Strength Index (RSI)
14-Day RSI: 59.26
Interpretation: The RSI is in the neutral zone (50–70), suggesting neither overbought nor oversold conditions.
Moving Average Convergence Divergence (MACD)
MACD Value: 9.44
Signal: Positive MACD indicates upward momentum.
Stochastic RSI
Value: 53.95
Interpretation: Neutral, with no immediate overbought or oversold signals.
🔍 Summary
Trend: Bullish
Indicators: Most technical indicators are aligned with a positive outlook.
Resistance Levels: ₹211.79 (52-week high)
Support Levels: ₹173.47 (20-day EMA)
相关出版物
免责声明
The information and publications are not meant to be, and do not constitute, financial, investment, trading, or other types of advice or recommendations supplied or endorsed by TradingView. Read more in the Terms of Use.
相关出版物
免责声明
The information and publications are not meant to be, and do not constitute, financial, investment, trading, or other types of advice or recommendations supplied or endorsed by TradingView. Read more in the Terms of Use.