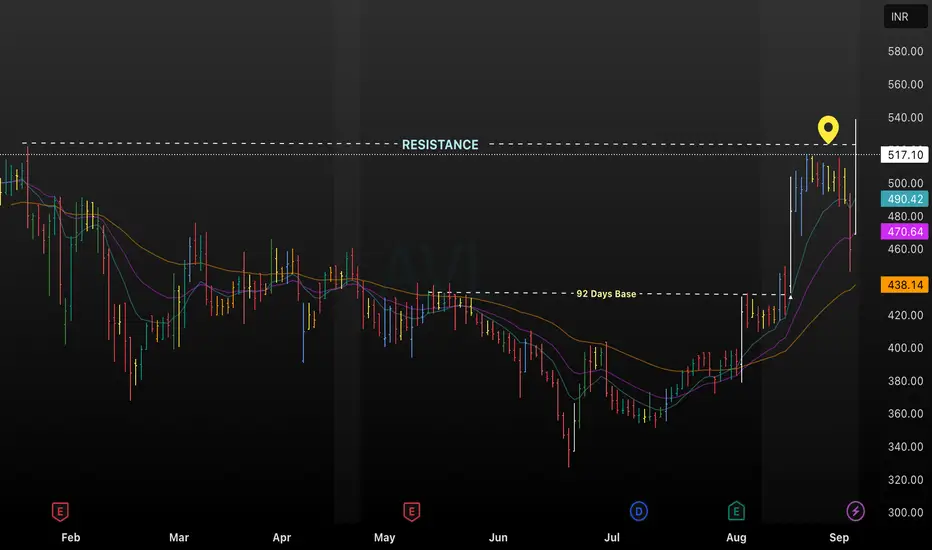
This AVL daily chart highlights a crucial resistance level near ₹540 after a robust 92-day base formation. The recent breakout above this resistance zone signals potential bullish strength, supported by moving averages (EMA 20, 50, 100, 200) currently trending upward above ₹438. A sharp price surge to ₹517 is visible, with strong momentum and historical base support, suggesting possible continuation if resistance sustains.
Use this structure to maximize engagement and provide clarity for community members or followers analyzing AVL’s price action.
Use this structure to maximize engagement and provide clarity for community members or followers analyzing AVL’s price action.
免责声明
这些信息和出版物并非旨在提供,也不构成TradingView提供或认可的任何形式的财务、投资、交易或其他类型的建议或推荐。请阅读使用条款了解更多信息。
免责声明
这些信息和出版物并非旨在提供,也不构成TradingView提供或认可的任何形式的财务、投资、交易或其他类型的建议或推荐。请阅读使用条款了解更多信息。