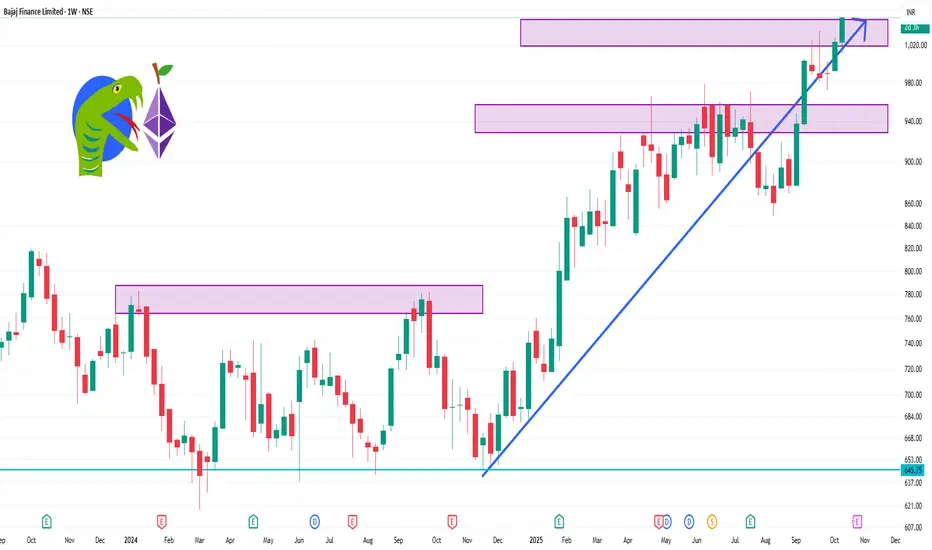
📈 Weekly Technical Levels
Resistance Levels: ₹1,036.75 (short-term), ₹1,023.85 (mid-term)
Support Levels: ₹1,009.85 (short-term), ₹938 (mid-term), ₹816.86 (long-term)
These levels suggest that the stock is trading above its key support zones, indicating a potential continuation of the uptrend.
🔧 Key Technical Indicators
RSI (14): 66.57 — approaching overbought territory, but still room for upward movement.
MACD: 20.92 — indicates bullish momentum.
ADX (14): 31.50 — suggests a strong trend.
Supertrend: ₹973.61 — currently bullish.
Parabolic SAR: ₹982.79 — supports the bullish trend.
Stochastic Oscillator: 84.34 — near overbought levels, indicating potential for a pullback.
Commodity Channel Index (CCI): +131.56 — suggests the stock is overbought.
These indicators collectively point towards a strong bullish trend, though caution is advised as some indicators approach overbought conditions.
相关出版物
免责声明
这些信息和出版物并不意味着也不构成TradingView提供或认可的金融、投资、交易或其它类型的建议或背书。请在使用条款阅读更多信息。