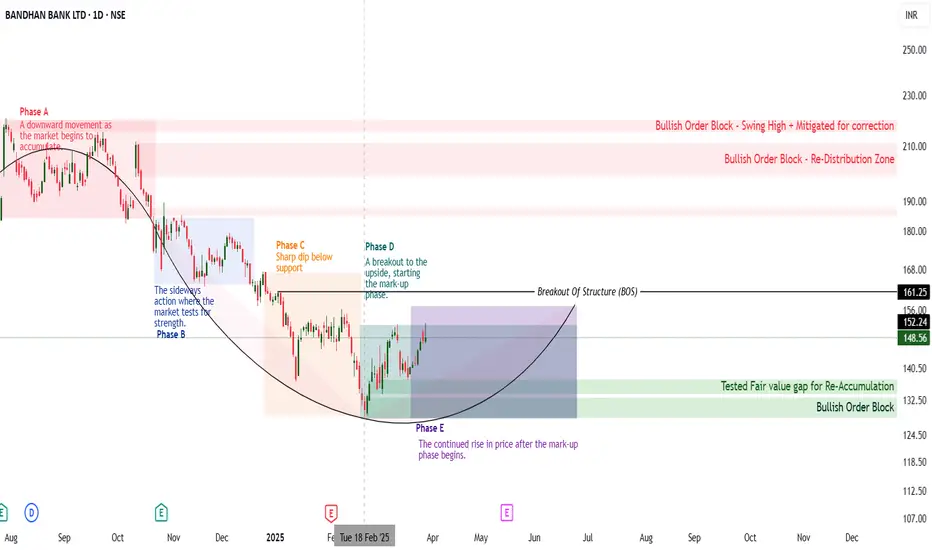
Wyckoff Cycle Phases for Bandhan Bank
Phase A:
Phase B:
Phase C:
Phase D:
Phase E
Wyckoff Cycle with BOS at ₹161 for Bandhan Bank
Given the Breakout of Structure (BOS) at ₹161, we can project the following:
1. Phase D to E: After ₹161 is broken, we are likely in Phase D (Mark-Up), where the price moves toward the higher targets of ₹185 and ₹209. This break signifies the start of the uptrend continuation from Phase D into Phase E.
Key Levels:
2. BOS at ₹161 signals a breakout, entering the Mark-Up phase (Phase D).
3. No Trade Zone:
The no trade zone between ₹137 to ₹152 signifies the area where price is consolidating, with potential erratic price movements. It is best to wait for a clear breakout above ₹161 for a long position.
Disclaimer: This analysis is for educational purposes only. Investors should conduct their own research before making any trading decisions.
Phase A:
- Accumulation (219 to 184)
- Within the ₹219 to ₹184 range as it prepares for the next phase (Phase B). The goal is to establish support at the lower end of this range.
Phase B:
- Testing (184 to 163)
- Bandhan Bank moves sideways, indicating a period of uncertainty and indecision. A breakout above ₹163 or below ₹163 will lead to the next phase.
Phase C:
- Spring (Shakeout) (167 to 128)
- The sharp dip to ₹128 represents the shakeout where weak holders are eliminated. After the dip, the price will likely start to recover.
Phase D:
- Mark-Up (128 to 152)
- Bandhan Bank begins to break out from ₹128 to ₹152, marking the transition to a bullish phase. Look for a continuation above ₹152
Phase E
- Mark-Up Continuation (133 to 153)
- The price continues its rise, moving between ₹133 to ₹153, with targets set at ₹185 and ₹209 as the price continues upward.
Wyckoff Cycle with BOS at ₹161 for Bandhan Bank
Given the Breakout of Structure (BOS) at ₹161, we can project the following:
1. Phase D to E: After ₹161 is broken, we are likely in Phase D (Mark-Up), where the price moves toward the higher targets of ₹185 and ₹209. This break signifies the start of the uptrend continuation from Phase D into Phase E.
Key Levels:
2. BOS at ₹161 signals a breakout, entering the Mark-Up phase (Phase D).
- Target 1: ₹185 (Next resistance level in the mark-up phase).
- Target 2: ₹209 (Higher target as the mark-up continues).
3. No Trade Zone:
The no trade zone between ₹137 to ₹152 signifies the area where price is consolidating, with potential erratic price movements. It is best to wait for a clear breakout above ₹161 for a long position.
Disclaimer: This analysis is for educational purposes only. Investors should conduct their own research before making any trading decisions.
免责声明
这些信息和出版物并不意味着也不构成TradingView提供或认可的金融、投资、交易或其它类型的建议或背书。请在使用条款阅读更多信息。