~~ Technical Analysis ~~
# Current Levels and Trends:
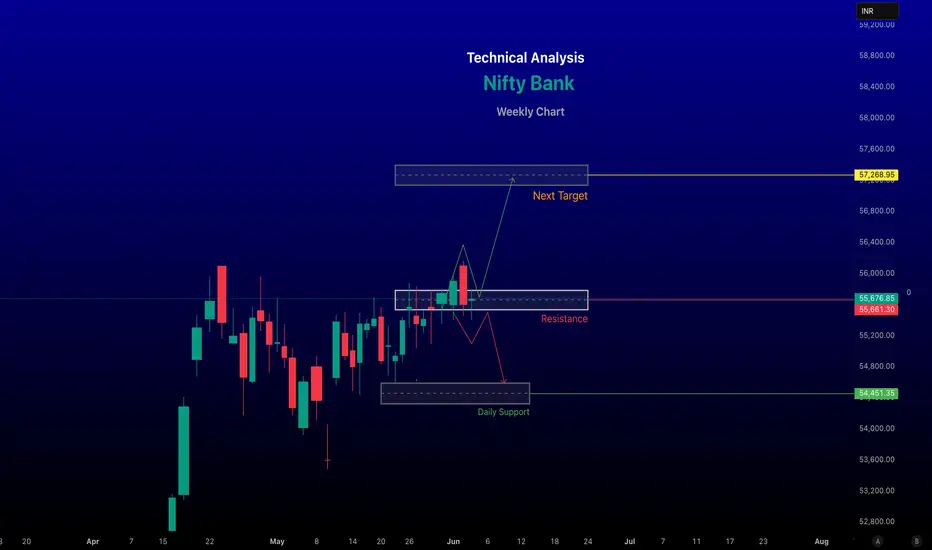
As of recent data, the Bank Nifty closed at 55,903.40 on June 2, 2025, up by 153.70 points (+0.28%). The index is trading within an ascending channel on the 15-minute chart, indicating short-term bullish momentum, while the daily timeframe shows a bullish structure with expectations of further upside in the coming months.
Support Levels: Immediate support lies in the 54,530–54,470 range. A break below this could trigger selling pressure, potentially pushing the index toward 54,000 or lower.
Resistance Levels: Key resistance is at 55,950–56,000. Sustaining above 56,000 could signal stronger bullish momentum, with potential targets at 56,750, 57,250, or even 58,000+ in the near term.
Recent Highs and Lows: The 52-week range is 46,077.85–56,098.70, with the index near its all-time high, indicating strong performance year-to-date (+9.26%).
-- Disclaimer --
This analysis is based on recent technical data and market sentiment from web sources. It is for informational and educational purposes only and not financial advice. Trading involves high risks, and past performance does not guarantee future results. Always conduct your own research or consult a SEBI-registered advisor before trading.
#Boost for post will be highly appreciated
# Current Levels and Trends:
As of recent data, the Bank Nifty closed at 55,903.40 on June 2, 2025, up by 153.70 points (+0.28%). The index is trading within an ascending channel on the 15-minute chart, indicating short-term bullish momentum, while the daily timeframe shows a bullish structure with expectations of further upside in the coming months.
Support Levels: Immediate support lies in the 54,530–54,470 range. A break below this could trigger selling pressure, potentially pushing the index toward 54,000 or lower.
Resistance Levels: Key resistance is at 55,950–56,000. Sustaining above 56,000 could signal stronger bullish momentum, with potential targets at 56,750, 57,250, or even 58,000+ in the near term.
Recent Highs and Lows: The 52-week range is 46,077.85–56,098.70, with the index near its all-time high, indicating strong performance year-to-date (+9.26%).
-- Disclaimer --
This analysis is based on recent technical data and market sentiment from web sources. It is for informational and educational purposes only and not financial advice. Trading involves high risks, and past performance does not guarantee future results. Always conduct your own research or consult a SEBI-registered advisor before trading.
#Boost for post will be highly appreciated
交易开始
target is about to hitrenderwithme
相关出版物
免责声明
这些信息和出版物并非旨在提供,也不构成TradingView提供或认可的任何形式的财务、投资、交易或其他类型的建议或推荐。请阅读使用条款了解更多信息。