Bank Nifty has recently shown a significant technical development that could mark a short-term reversal: a breakdown from a rising wedge pattern below its support trendline. The rising wedge is generally a bearish reversal pattern when occurring after an uptrend, and in this case, the structure has played out with textbook precision.
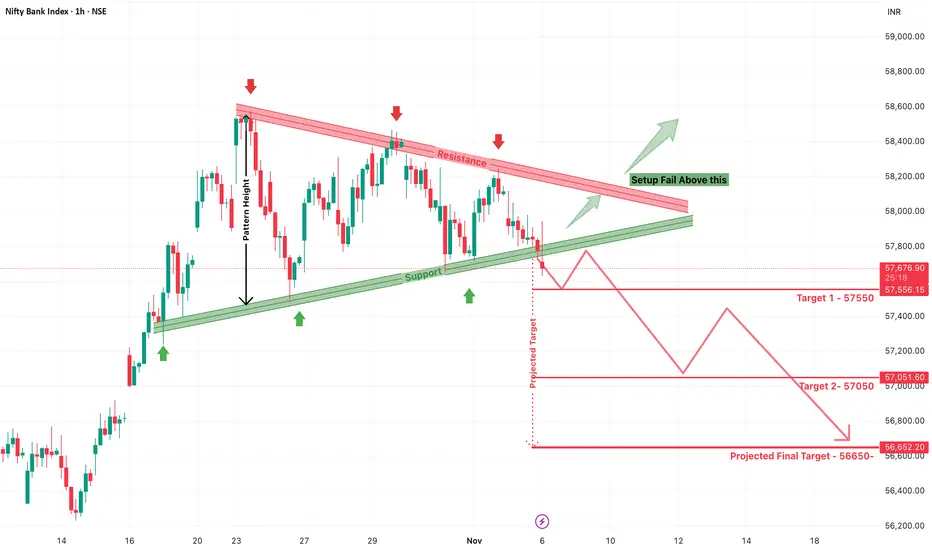
Initially, Bank Nifty attempted to break above the resistance zone around 58,200–58,400, but it failed to sustain the move. This fake breakout, often referred to as a bull trap, is a strong bearish signal—especially when followed by a clean breakdown of the support line, as seen near the 57,800 level. The price has now convincingly moved below this support zone, confirming a potential trend reversal.
The pattern's height, which represents the distance between the highest swing high and lowest swing low within the wedge, has been used to project the downside targets. According to this breakdown setup, the following bearish targets are now in play:
Target 1: 57,550
Target 2: 57,050
Projected Final Target: 56,650
These targets are marked clearly on the chart and represent areas where price action may find temporary support or experience short-covering bounces. However, unless Bank Nifty reclaims the upper wedge zone and invalidates the breakdown, the path of least resistance remains downward.
What makes this move even more credible is the series of lower highs formed under resistance, showing consistent selling pressure. Simultaneously, the failed breakout has likely triggered stop losses of aggressive long positions, adding to the downward momentum.
Traders should now watch for confirmation of this breakdown with volume and follow-through candles. Any bounce back to the 57,800–58,000 zone should be approached with caution, as it may act as a fresh supply zone unless strongly reclaimed.
📈 Trade Smarter with TradZoo!
📣 Telegram: t.me/tradzooIndex
📣 Forex Telegram: t.me/tradzoofx
📲 Mobile App: tradzoo.com/download
📲 Forex App:tradzoo.com/forex/download
🔗 Website: bit.ly/tradzoopage
📣 Telegram: t.me/tradzooIndex
📣 Forex Telegram: t.me/tradzoofx
📲 Mobile App: tradzoo.com/download
📲 Forex App:tradzoo.com/forex/download
🔗 Website: bit.ly/tradzoopage
免责声明
这些信息和出版物并不意味着也不构成TradingView提供或认可的金融、投资、交易或其它类型的建议或背书。请在使用条款阅读更多信息。