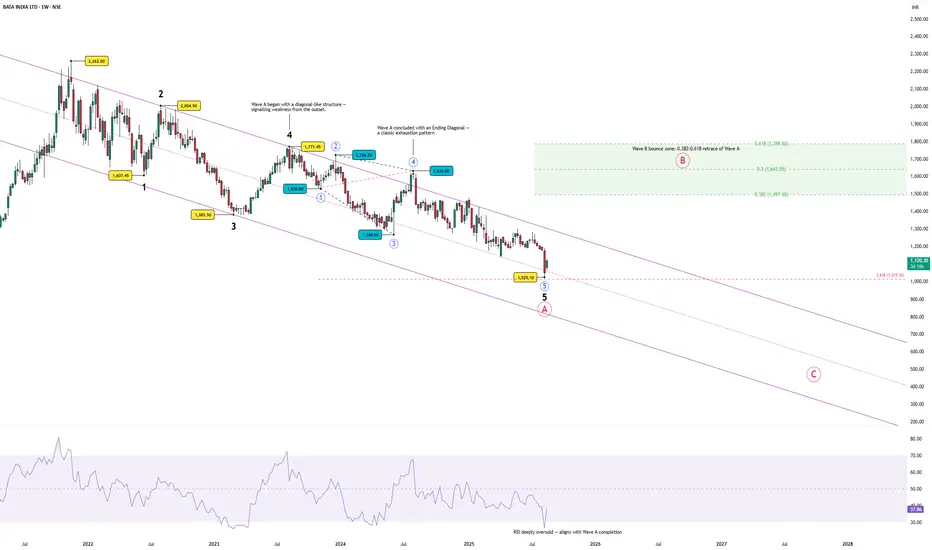
From its 2021 peak, Bata appears to have completed a full 5-wave decline, labelled as Wave A of a larger A–B–C corrective structure.
With Wave A likely complete, attention now shifts to a corrective Wave B bounce. Typical retracement zones for Wave B lie between 0.382–0.618 of Wave A, i.e. ₹1,497 – ₹1,789. This remains the primary target area for the bounce before the larger downtrend resumes into Wave C.
Once Wave B completes, the focus would turn to Wave C, which often mirrors Wave A in length, implying that the broader correction may not be over yet.
Disclaimer:
This analysis is for educational purposes only and does not constitute investment advice. Please do your own research (DYOR) before making any trading decisions.
- The decline began with a diagonal-like structure, signalling weakness right from the outset.
- It ended with an Ending Diagonal in Wave 5, a classic pattern of market exhaustion.
- RSI is deeply oversold, aligning with the possibility that Wave A has reached completion.
With Wave A likely complete, attention now shifts to a corrective Wave B bounce. Typical retracement zones for Wave B lie between 0.382–0.618 of Wave A, i.e. ₹1,497 – ₹1,789. This remains the primary target area for the bounce before the larger downtrend resumes into Wave C.
Once Wave B completes, the focus would turn to Wave C, which often mirrors Wave A in length, implying that the broader correction may not be over yet.
Disclaimer:
This analysis is for educational purposes only and does not constitute investment advice. Please do your own research (DYOR) before making any trading decisions.
WaveXplorer | Elliott Wave insights
📊 X profile: @veerappa89
📊 X profile: @veerappa89
免责声明
这些信息和出版物并不意味着也不构成TradingView提供或认可的金融、投资、交易或其它类型的建议或背书。请在使用条款阅读更多信息。
WaveXplorer | Elliott Wave insights
📊 X profile: @veerappa89
📊 X profile: @veerappa89
免责声明
这些信息和出版物并不意味着也不构成TradingView提供或认可的金融、投资、交易或其它类型的建议或背书。请在使用条款阅读更多信息。