📊 Daily Support and Resistance Levels
Immediate Support: ₹1,204.27
Short-Term Support: ₹1,188.23
Key Resistance: ₹1,245.83
Short-Term Resistance: ₹1,233.07
🔁 Pivot Points (Daily)
Central Pivot Point (CPR): ₹1,217.03
Resistance Levels: ₹1,245.83, ₹1,261.87
Support Levels: ₹1,175.47, ₹1,188.23
📈 Technical Indicators
Relative Strength Index (RSI): Currently, the RSI is between 45 and 55, indicating a neutral market condition.
Moving Averages: The stock is trading near its short-term moving averages, suggesting a consolidation phase.
Volume: Moderate trading volume observed, indicating steady investor interest.
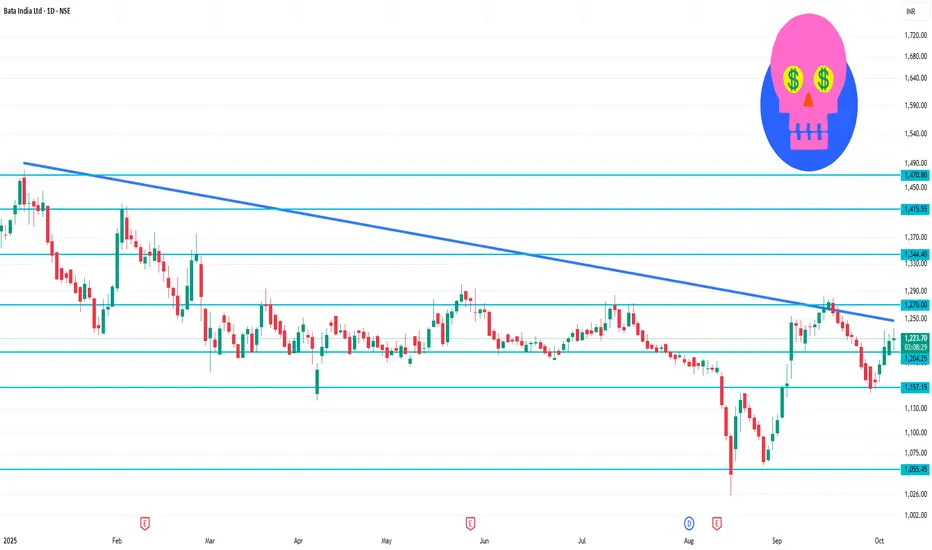
✅ Trade Insights
Bata India Ltd is currently in a neutral trend on the daily chart. A breakout above ₹1,245.83 could signal a bullish move towards ₹1,261.87. Conversely, a drop below ₹1,204.27 may indicate further downside.
Immediate Support: ₹1,204.27
Short-Term Support: ₹1,188.23
Key Resistance: ₹1,245.83
Short-Term Resistance: ₹1,233.07
🔁 Pivot Points (Daily)
Central Pivot Point (CPR): ₹1,217.03
Resistance Levels: ₹1,245.83, ₹1,261.87
Support Levels: ₹1,175.47, ₹1,188.23
📈 Technical Indicators
Relative Strength Index (RSI): Currently, the RSI is between 45 and 55, indicating a neutral market condition.
Moving Averages: The stock is trading near its short-term moving averages, suggesting a consolidation phase.
Volume: Moderate trading volume observed, indicating steady investor interest.
✅ Trade Insights
Bata India Ltd is currently in a neutral trend on the daily chart. A breakout above ₹1,245.83 could signal a bullish move towards ₹1,261.87. Conversely, a drop below ₹1,204.27 may indicate further downside.
相关出版物
免责声明
这些信息和出版物并不意味着也不构成TradingView提供或认可的金融、投资、交易或其它类型的建议或背书。请在使用条款阅读更多信息。