A few caveats here, but BATBTC is starting to look pretty good.
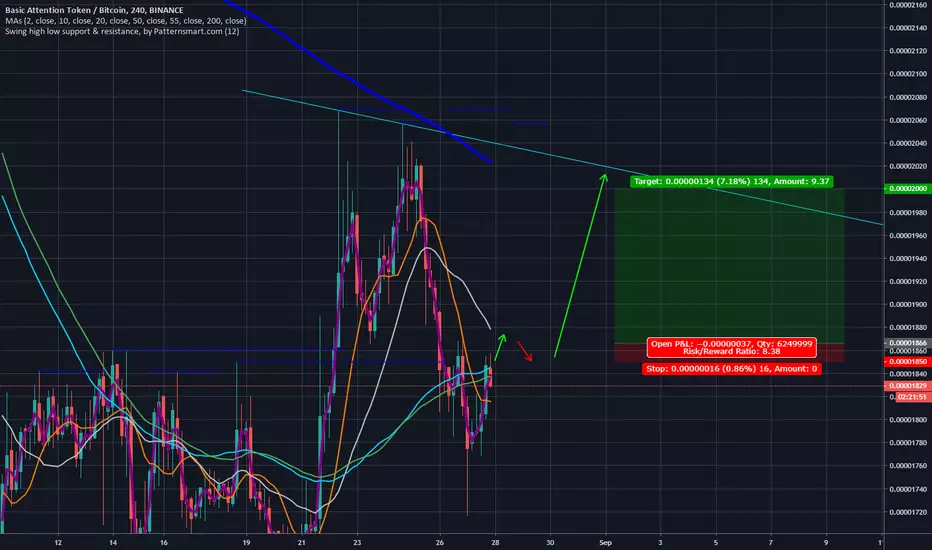
The 4hr is trying to break above the resistance zones around the 1860 sats. IF you are going to play this long position, always make sure that you understand that typically there is a retrace after a breakout. So when we break above the 1860 sats and are also above the 10 and 20 MA, allow it to retrace 1-2 candles. You will want to buy in after the retrace and above the retraced support.
Set your stop loss to the bottom of your retrace candle (plus a little slippage) and enter into a position above support. I would set up a limit order for this scenario and place it once we are above all the MAs. Looking at possibly 2000 sats or somewhere around the aqua trend line for profit.
注释
Ok guys, things are still looking good. We are STILL NOT YET active in our trade. We are waiting out the 4hr close on this thing.
So the current 4hr candle MUST close above the 100 MA (white line) or this could end up being a bull trap.
There is a circumstance where it closes above the 1859 resistance but below the 100 MA and this trade idea can still be active...
However, if that happens, you will need confirmation of the 2nd 4hr candle after this one closes (so the candle after the next 4hr candle)... If that candle is NOT touching the 100 MA, the trade is a go and put your stop loss at the bottom end of the candle between the 100 MA and resistance... So in this scenario it would be somewhere like 1856 sats or something to account for slippage.
注释
And just so everyone understands the dynamics of a bull trap, as you can see, the current candle is acting explosively, making everyone think that we are past all resistance...Except that the candle is still touching both resistance lines PLUS the 100 MA. If we get the next candle after this outside the 100 MA, that's when you get into this position... Otherwise this can turn into a perfect bull trap example, where you are in a long position and price suddenly reverses, and people don't know why.
Your candles MUST clear both resistance and any MA that may act as resistance on the way up. Any candle that is touching any of those is NOT where we would get into a long position.
注释
QUICK NOTE: the white MA line I was referring to is the 20 MA, and not 100 MA. Apologies.交易开始
Position open now注释
Going through what I feel is a bear trap before pulling higher.
If at any time the 4hr touches the MAs below it, I would get out of the long.
Also, the 200 MA has extended below 4hr resistance. A conservative approach may be to close the long if we are unable to push past it.
免责声明
这些信息和出版物并非旨在提供,也不构成TradingView提供或认可的任何形式的财务、投资、交易或其他类型的建议或推荐。请阅读使用条款了解更多信息。