This is one example of why Elliot Wave Theory and Chart Patterns are so neat. Check out this chart.
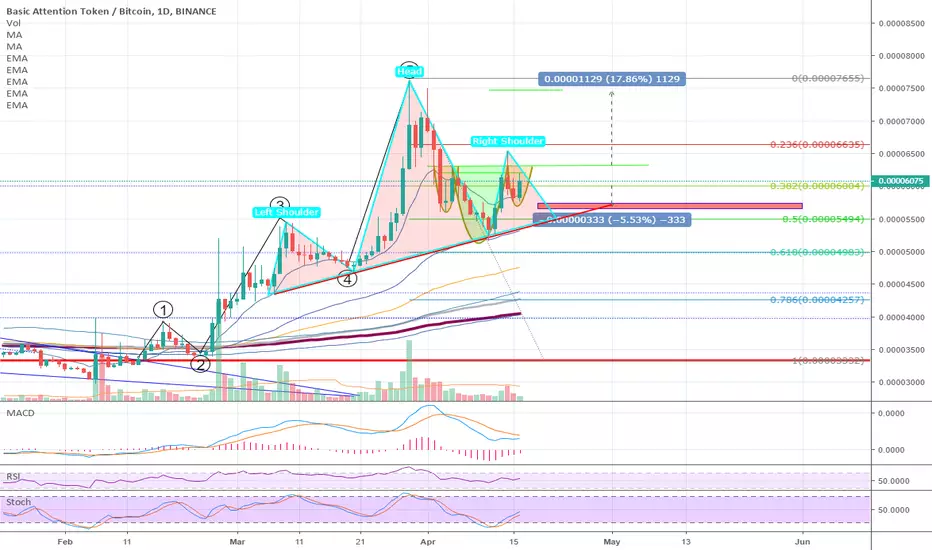
You see a bullish inverted H&S nested inside of an much larger H&S. Which will complete and then confirm? SWEET!
You see a bullish inverted H&S nested inside of an much larger H&S. Which will complete and then confirm? SWEET!
注释
I am going to Gamble in this one with some of my trade account.I am already bought in.
I am watching for the inverted H&S right shoulder to complete
and then retrace a bit before bouncing around and up 15% - 20%
depending on where you buy in.
I am watching for the that right shoulder to also breakdown and drop
to the red line, completing the bearish H&S on the higher time scale.
If this completes and confirms then the pattern would dictate and incoming
drop of quite a lot.....
on the Macro side of things either of these outcomes would play into BTC moves as well... BTC remains stable to goes up and probably BAT up. BTC drops down a bit or flashes up either moves could drop BAT and most likely closes the larger H&S.
Market Sentiment will decide. Two patterns MACD RSI STOCH all room to go either way.
*I have BAT and I am bullish on BAT long term*
交易开始
Profits so far here are between 5% and 25% depending on when you got into this trade. Here it reached a point where we need to pay attention. Are we continuing up or is this a double top and into a retrace.交易结束:到达目标
We have reached the target. 10% - 25% depending on when you joined.Enjoy.
Take profit here and leave some to ride it out. I will be setting some ladder sells in case it starts to drop from here. You never know it could still go up, but the chart patters I was following has completed. the target .000007400 has been hit. Thanks for riding along.
免责声明
这些信息和出版物并非旨在提供,也不构成TradingView提供或认可的任何形式的财务、投资、交易或其他类型的建议或推荐。请阅读使用条款了解更多信息。
免责声明
这些信息和出版物并非旨在提供,也不构成TradingView提供或认可的任何形式的财务、投资、交易或其他类型的建议或推荐。请阅读使用条款了解更多信息。