做空
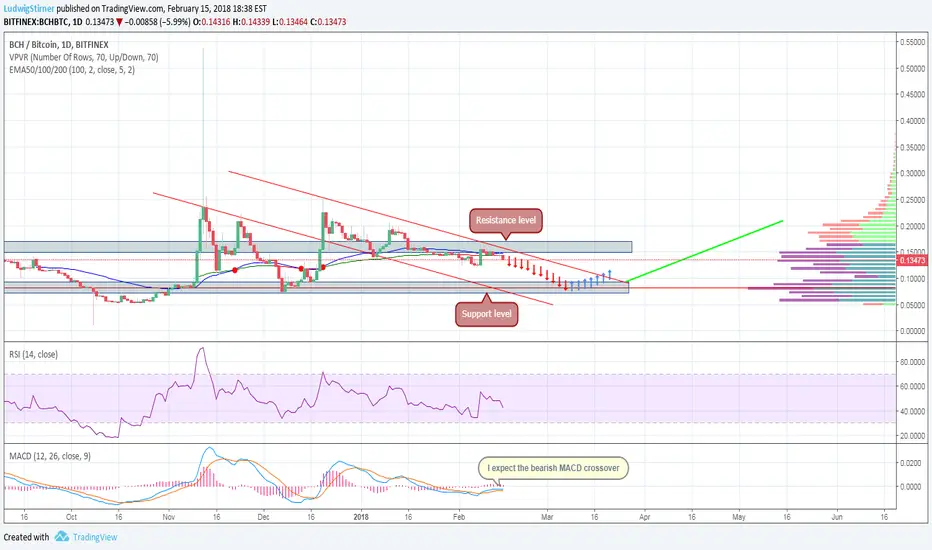
Bitcoin Cash chart is still down

Long term, the trend of the Bitcoin Cash chart is still down. The 100-Day EMA provide significant resistance. The upper descending trend line also provide strong resistance.
RSI is below 50, a sign of an down trend. The MACD turned down but earlier the MACD showed positive divergence indicating the uptrend would begin however it might possible to be a fake buy signal.
RSI is below 50, a sign of an down trend. The MACD turned down but earlier the MACD showed positive divergence indicating the uptrend would begin however it might possible to be a fake buy signal.
免责声明
这些信息和出版物并不意味着也不构成TradingView提供或认可的金融、投资、交易或其它类型的建议或背书。请在使用条款阅读更多信息。
免责声明
这些信息和出版物并不意味着也不构成TradingView提供或认可的金融、投资、交易或其它类型的建议或背书。请在使用条款阅读更多信息。