📊 Chart Observations (Daily Timeframe):
🔻 Recent Trend:
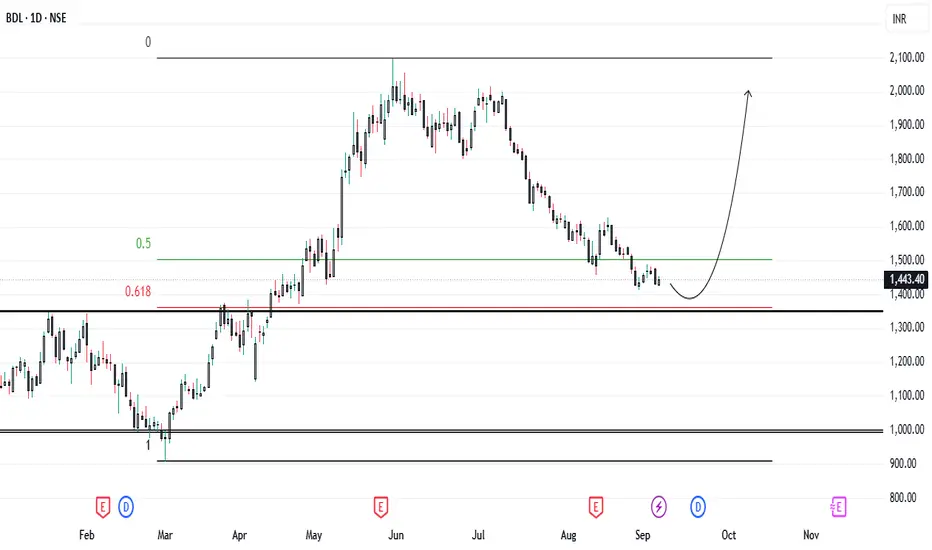
Stock has been in a steady downtrend since its June peak, witnessing consistent lower highs and lower lows.
🛑 Support Zone:
Current price (₹1,443) is hovering near the critical 0.618 Fibonacci retracement level (\~₹1,400) – a strong demand zone historically respected by buyers.
✅ Bullish Reversal Zone:
Price is showing signs of base-building around this key support, which could act as a springboard for a bounce.
📈 Resistance Levels to Watch:
* Immediate resistance: ₹1,500–₹1,550 (0.5 Fib level)
* Major upside target: ₹1,900–₹2,000 zone (previous supply area)
🕰️ Pattern Formation:
Chart hints at a potential U-shaped recovery if ₹1,400 holds firmly, aligning with the projected upward arrow shown.
🔑 Risk Management:
* Stoploss: Below ₹1,250 (clean invalidation level)
* Reward-to-Risk looks favorable with nearly 30–35% potential upside.
⚡ Key Takeaway
If BDL sustains above the ₹1,400–₹1,420 demand zone, we could see a strong reversal rally towards ₹2,000+ in the coming weeks. However, a breakdown below ₹1,250 may extend weakness toward ₹1,200 levels.
🔥 Trading Idea:
Buy on dips near ₹1,420–₹1,440 with SL ₹1,250
Target: ₹1,900–₹2,000
🔻 Recent Trend:
Stock has been in a steady downtrend since its June peak, witnessing consistent lower highs and lower lows.
🛑 Support Zone:
Current price (₹1,443) is hovering near the critical 0.618 Fibonacci retracement level (\~₹1,400) – a strong demand zone historically respected by buyers.
✅ Bullish Reversal Zone:
Price is showing signs of base-building around this key support, which could act as a springboard for a bounce.
📈 Resistance Levels to Watch:
* Immediate resistance: ₹1,500–₹1,550 (0.5 Fib level)
* Major upside target: ₹1,900–₹2,000 zone (previous supply area)
🕰️ Pattern Formation:
Chart hints at a potential U-shaped recovery if ₹1,400 holds firmly, aligning with the projected upward arrow shown.
🔑 Risk Management:
* Stoploss: Below ₹1,250 (clean invalidation level)
* Reward-to-Risk looks favorable with nearly 30–35% potential upside.
⚡ Key Takeaway
If BDL sustains above the ₹1,400–₹1,420 demand zone, we could see a strong reversal rally towards ₹2,000+ in the coming weeks. However, a breakdown below ₹1,250 may extend weakness toward ₹1,200 levels.
🔥 Trading Idea:
Buy on dips near ₹1,420–₹1,440 with SL ₹1,250
Target: ₹1,900–₹2,000
免责声明
这些信息和出版物并不意味着也不构成TradingView提供或认可的金融、投资、交易或其它类型的建议或背书。请在使用条款阅读更多信息。
免责声明
这些信息和出版物并不意味着也不构成TradingView提供或认可的金融、投资、交易或其它类型的建议或背书。请在使用条款阅读更多信息。