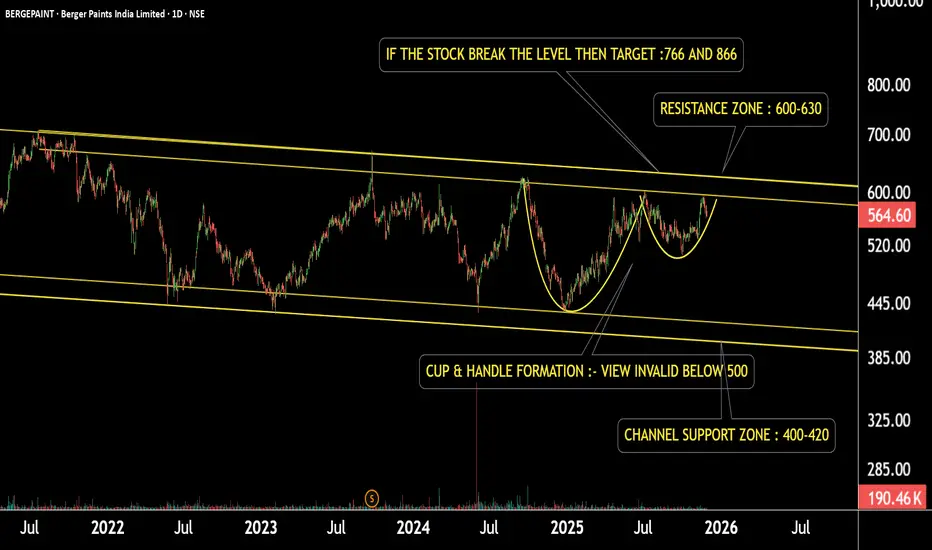
This is the daily timeframe chart of Berger Paint.
The stock is moving within a well-defined channel and has formed a Cup & Handle pattern inside the structure.
If the pattern continues to hold and the price stays above ₹500, the pattern remains valid.
A breakout above the resistance may trigger potential upside targets of ₹766 and ₹866.
However, if the price fails and breaks below this zone, the stock may decline toward the channel support near ₹400.
Thank you.
@RahulSaraoge
Connect us at t.me/stridesadvisory
Connect us at t.me/stridesadvisory
免责声明
这些信息和出版物并非旨在提供,也不构成TradingView提供或认可的任何形式的财务、投资、交易或其他类型的建议或推荐。请阅读使用条款了解更多信息。
@RahulSaraoge
Connect us at t.me/stridesadvisory
Connect us at t.me/stridesadvisory
免责声明
这些信息和出版物并非旨在提供,也不构成TradingView提供或认可的任何形式的财务、投资、交易或其他类型的建议或推荐。请阅读使用条款了解更多信息。