Fibonacci Levels and Trading Setup
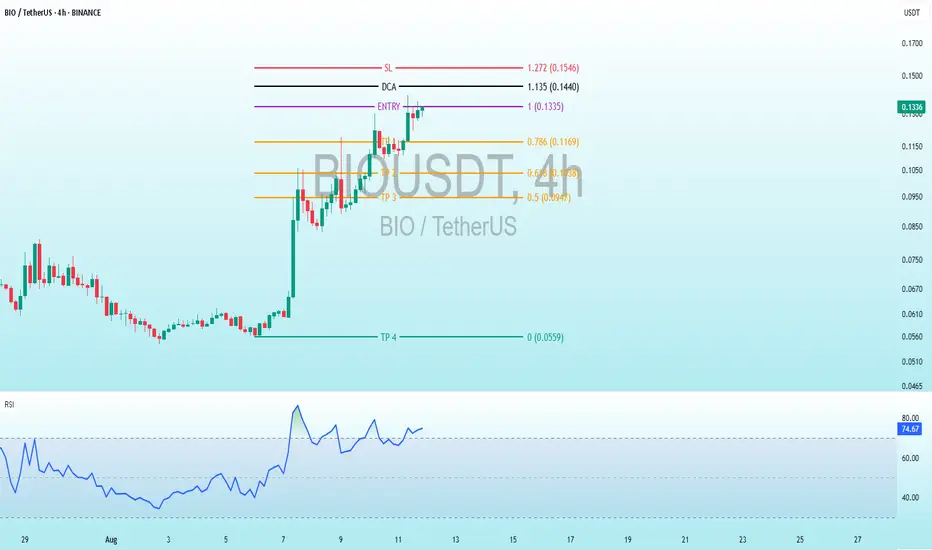
These levels appear to be Fibonacci retracement/extension levels, drawn from a low (0% at 0.0559 USD) to a high (100% at 0.1335 USD), but used for a short setup. This is unusual for an uptrend but suggests the chart creator (AltcoinPioneers) expects a decline after the pullback. Here are the detailed levels (with prices in brackets):
SL (Stop Loss, red): 1.272 (0.1546 USD) – Extension level above 100%, where the position closes if the price rises further (maximum risk).
DCA (black): 1.135 (0.1440 USD) – Possibly a level to add to the short (average down) if the price rises slightly, to lower the average cost.
ENTRY (purple): 1 (0.1335 USD) – Entry level for short (sell). The current price is very close (0.1310), so it might be active or pending.
TP1 (orange): 0.786 (0.1169 USD) – First Take Profit, a retracement level.
TP2 (orange): 0.614 (0.1038 USD) – Second TP, near the golden ratio (0.618).
TP3 (orange): 0.5 (0.0947 USD) – Third TP, half of the range.
TP4 (green?): 0 (0.0559 USD) – Final TP, at the previous low.
RSI Indicator Analysis
Current Value: Around 70-73, with the blue line peaking at ~80 and now slightly declining.
RSI Trend: Started from ~30 (oversold) during the price decline, rose sharply with the upward impulse (indicating bullish momentum), but is now in the overbought zone (>70). This signals the asset might be "overpriced" in the short term, and a correction downward is possible (bearish divergence if the price doesn’t confirm upward movement).
Interpretation: An RSI above 70 often precedes a pullback or bearish reversal, especially on a 4h timeframe. If it falls below 50, it confirms weakness.
交易开始
TP 1 FILLED
+12.59% PROFIT
✅MY Free Signals Telegram
t.me/AltcoinPiooners
✅Personal Telegram (Premium)
t.me/Altcoin_Piooners
✅YouTube
youtube.com/@AltcoinPiooners
t.me/AltcoinPiooners
✅Personal Telegram (Premium)
t.me/Altcoin_Piooners
✅YouTube
youtube.com/@AltcoinPiooners
免责声明
这些信息和出版物并非旨在提供,也不构成TradingView提供或认可的任何形式的财务、投资、交易或其他类型的建议或推荐。请阅读使用条款了解更多信息。