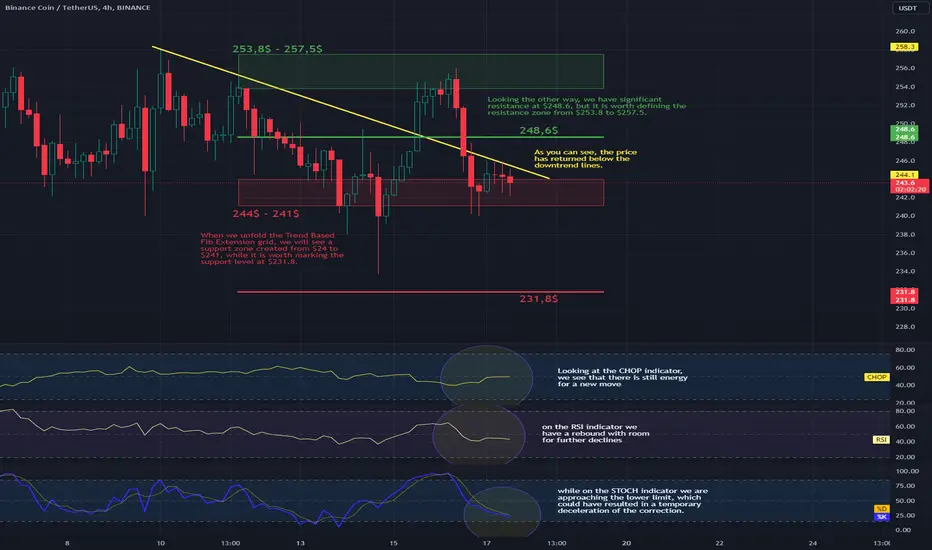
Hello everyone, let's take a look at the BNB to USDT chart on a 4-hour time frame. As you can see, the price has returned below the downtrend lines.
When we unfold the Trend Based Fib Extension grid, we will see a support zone created from $24 to $241, while it is worth marking the support level at $231.8.
Looking the other way, we have significant resistance at $248.6, but it is worth defining the resistance zone from $253.8 to $257.5.
Looking at the CHOP indicator, we see that there is still energy for a new move, on the RSI indicator we have a rebound with room for further declines, while on the STOCH indicator we are approaching the lower limit, which could have resulted in a temporary deceleration of the correction.
免责声明
这些信息和出版物并非旨在提供,也不构成TradingView提供或认可的任何形式的财务、投资、交易或其他类型的建议或推荐。请阅读使用条款了解更多信息。
免责声明
这些信息和出版物并非旨在提供,也不构成TradingView提供或认可的任何形式的财务、投资、交易或其他类型的建议或推荐。请阅读使用条款了解更多信息。