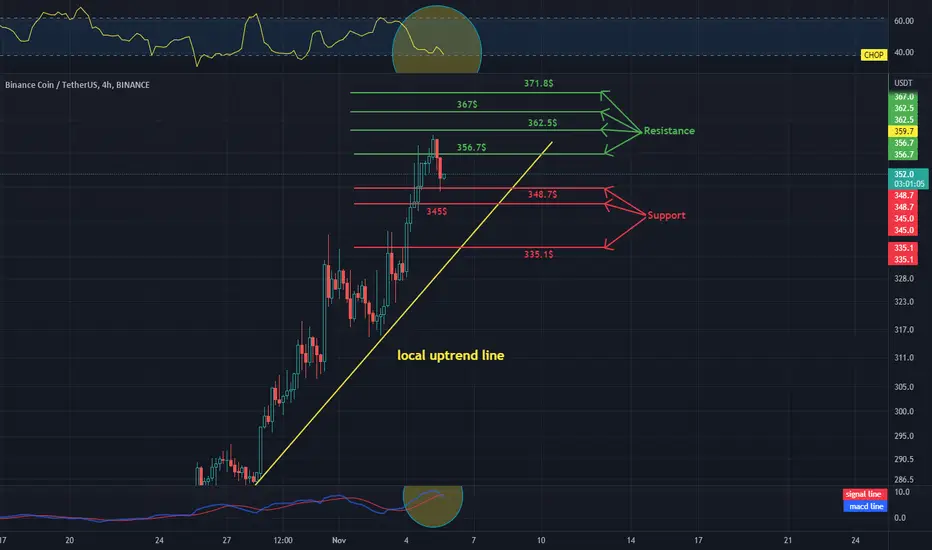
Hello everyone, let's take a look at the BNB to USDT chart over the four hour timeframe. As you can see, the price is moving above the local uptrend line.
Let's start with the line of support, and as you can see, the first support is three hundred and forty-eight dollars and seventy cents, the second support is three hundred and forty-five dollars, and the third support is three hundred and thirty-five dollars and ten cents.
Now let's move to the line of resistance, as you can see, the first resistance is three hundred and fifty-six dollars and seventy cents, the second resistance is at three hundred and sixty-two dollars fifty cents, the third is three hundred and sixty-seven dollars, and the fourth is three hundred and seventy-one dollars and eighty cents.
Looking at the CHOP indicator, we can see that the energy has been used up in the four-hour interval, and the makdi indicator shows a local downward trend.
免责声明
这些信息和出版物并不意味着也不构成TradingView提供或认可的金融、投资、交易或其它类型的建议或背书。请在使用条款阅读更多信息。
免责声明
这些信息和出版物并不意味着也不构成TradingView提供或认可的金融、投资、交易或其它类型的建议或背书。请在使用条款阅读更多信息。