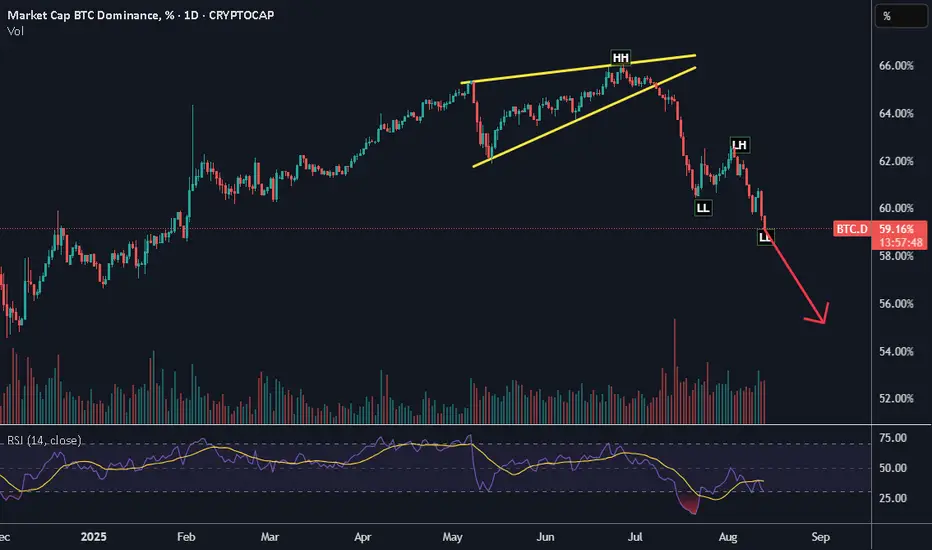
1️⃣ Pattern & Structure
We had a rising wedge formation earlier (yellow trend lines) — a bearish pattern.
The breakout happened to the downside, confirming bearish bias.
The chart is now printing Lower Highs (LH) and Lower Lows (LL) — a clear downtrend.
2️⃣ Current Situation
BTC dominance has just broken the 59% support level, which was a key horizontal support.
RSI is still low (around 38), meaning momentum is bearish but not yet extremely oversold — more downside possible.
Volume spikes during down moves show strong selling pressure.
3️⃣ Projection
Based on the technicals, BTC dominance could head towards the 56%–54% range (next major support).
This usually means altcoins may outperform Bitcoin in the coming sessions (alt season signs).
4️⃣ Trading Implication
If BTC dominance keeps dropping, money may rotate into ETH, SOL, other altcoins.
Watch for BTC dominance bounce near 56% — that could slow altcoin rally.
免责声明
这些信息和出版物并非旨在提供,也不构成TradingView提供或认可的任何形式的财务、投资、交易或其他类型的建议或推荐。请阅读使用条款了解更多信息。
免责声明
这些信息和出版物并非旨在提供,也不构成TradingView提供或认可的任何形式的财务、投资、交易或其他类型的建议或推荐。请阅读使用条款了解更多信息。