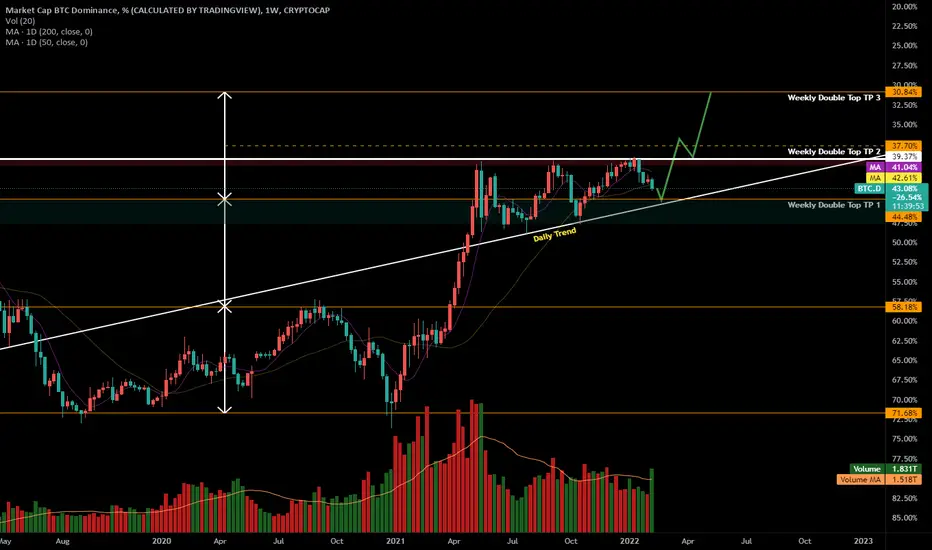
We saw a double top form prior to the massive correction on BTC.D. Price is consolidating around TP 1 of our double top target. We've gotten back above the daily 200 MA for the 2nd time. Last time that occurred we had a sharp rise followed by a sharp drop. We've also formed a wedge here with each attempt to break below 39-40% gaining strength.
It's possible we witness similar behavior to the previous push above the daily 200 MA, a brief and sharp rise towards the area around TP 1 and the top of our wedge, followed by a strong drop that results in breaking below our wedge and heading towards TP 2 and the 1.5x measured double top target.
TP 3 is a stretch goal at the 2x measured target. Chart is inverted for perspective.
免责声明
这些信息和出版物并非旨在提供,也不构成TradingView提供或认可的任何形式的财务、投资、交易或其他类型的建议或推荐。请阅读使用条款了解更多信息。
免责声明
这些信息和出版物并非旨在提供,也不构成TradingView提供或认可的任何形式的财务、投资、交易或其他类型的建议或推荐。请阅读使用条款了解更多信息。