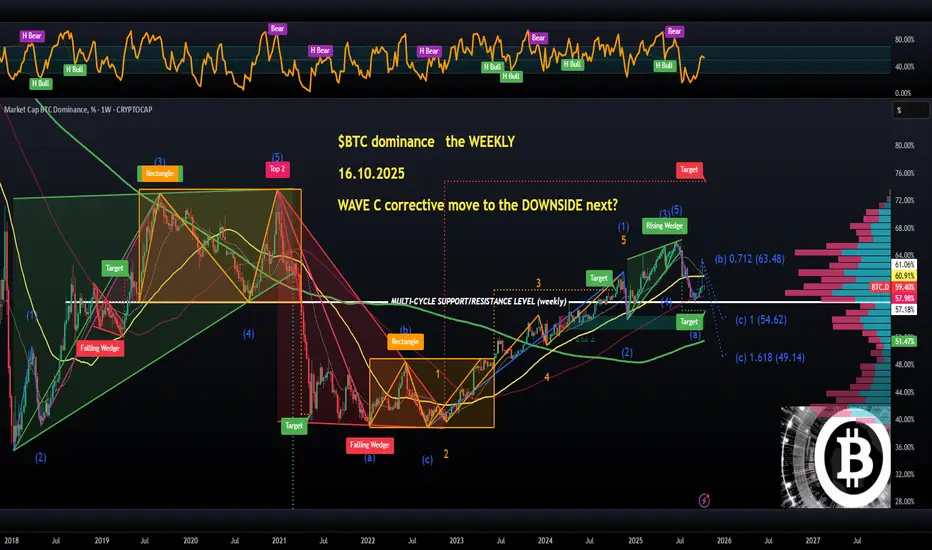
So the weekly chart is actually looking amazing for altcoins, we are most likely heading for a much deeper correction purely based on the technicals here, not speculation.
The most important level to watch is 57.2% as a multi-cycle SUPPORT/RESISTANCE level. Back in 2021, when that exact level broke down (orange RECTANCLE on the left side), it ended up crashing all the way down to 39%. That was a full-blown #Altseason which lasted for a few weeks.
Seasonality-wise, Q4 should be the best for crypto, so we would have a brilliant correlation if 57.2% becomes resistance again, so far, there was a bounce off it at the beginning of September, which triggered nothing but bleeding ever since.
So, this is a long-term view, if correct, then we should get a WAVE C correction to 54.6% or more optimistically, 49% or even below. I would bet on 49% personally, if I had to make a based guess.
👽💙
免责声明
这些信息和出版物并非旨在提供,也不构成TradingView提供或认可的任何形式的财务、投资、交易或其他类型的建议或推荐。请阅读使用条款了解更多信息。
免责声明
这些信息和出版物并非旨在提供,也不构成TradingView提供或认可的任何形式的财务、投资、交易或其他类型的建议或推荐。请阅读使用条款了解更多信息。