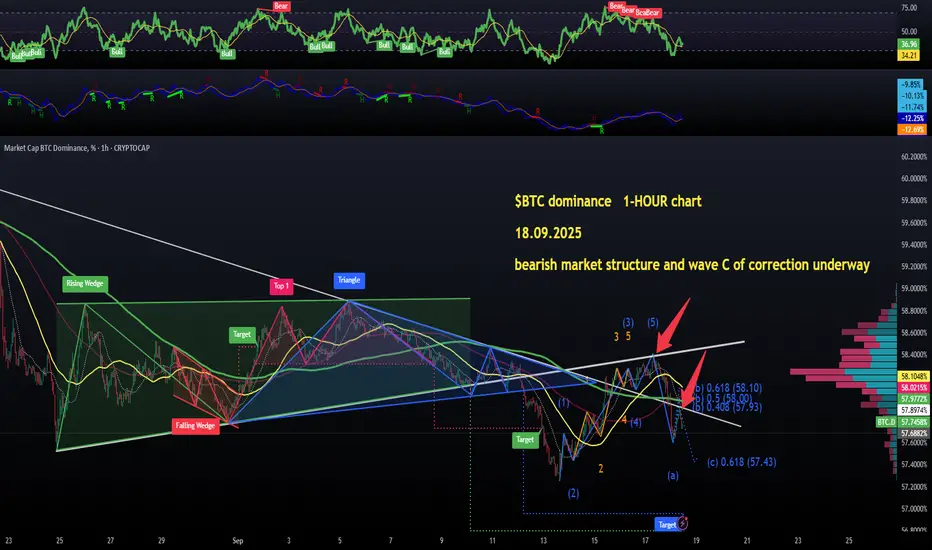
I highlighted a series of bear RSI divergences when the dominance was above 58.20% and these divergences have been playing out perfectly, predicting and end of the last wave up on the hourly chart.
Ascending resistance (lower trendline of the rising wedge that broke down on Sep 10) gave us a bearish retest from below and its's been a full-on correction here, currently in wave C targetting 57.43%.
That's why I have been in a few long positions immediately after the FOMC, which I did not plan, but the dominance chart dictates my moves💙👽
Also, it looks like in 40 days we are getting another 0.25% rate cut.
My thesis stays the same: great Q4 incoming.
免责声明
这些信息和出版物并不意味着也不构成TradingView提供或认可的金融、投资、交易或其它类型的建议或背书。请在使用条款阅读更多信息。
免责声明
这些信息和出版物并不意味着也不构成TradingView提供或认可的金融、投资、交易或其它类型的建议或背书。请在使用条款阅读更多信息。