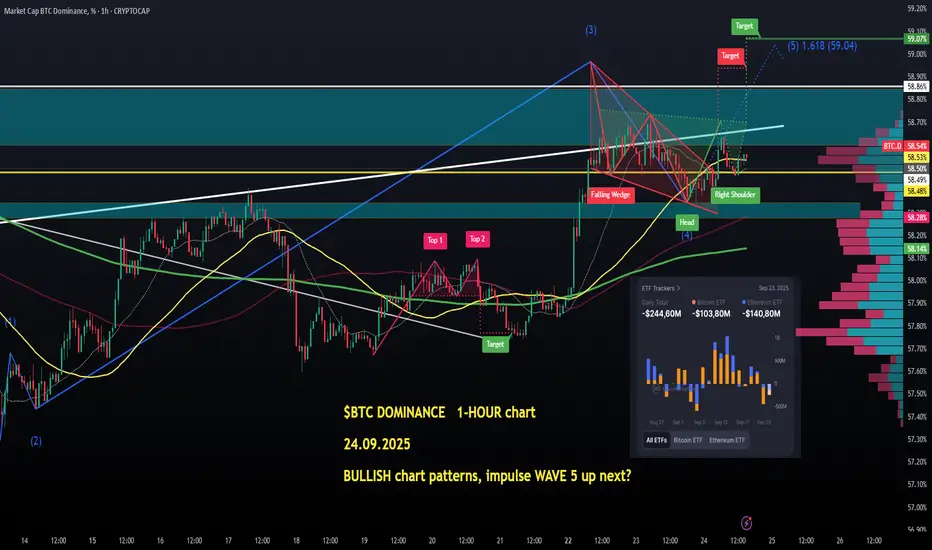
Zoomed in on the  BTC dominance HOURLY chart, and it's even more trouble for
  ETH and other #Alts due to the FALLING wedge breakout that happened overnight.
This short term pattern is pointing above 59% which would help the dominance cross above the resistance zone highlighed in light-blue overhead on my chart.
And to add to my thesis, a BULLISH inverted Head & Shoulders pattern has formed (neckline to break around 58.7%, target 59.07%).
Also WAVE 5 could be starting and its first target is sitting above 59% as well.
For the dominance to break down, we need it to crash below the immediate support zone (58.25% - 58.35%).
Watching the action closely on this 1-HOUR chart is a MUST today tbh💙👽
免责声明
这些信息和出版物并不意味着也不构成TradingView提供或认可的金融、投资、交易或其它类型的建议或背书。请在使用条款阅读更多信息。
免责声明
这些信息和出版物并不意味着也不构成TradingView提供或认可的金融、投资、交易或其它类型的建议或背书。请在使用条款阅读更多信息。