Bitcoin line and time
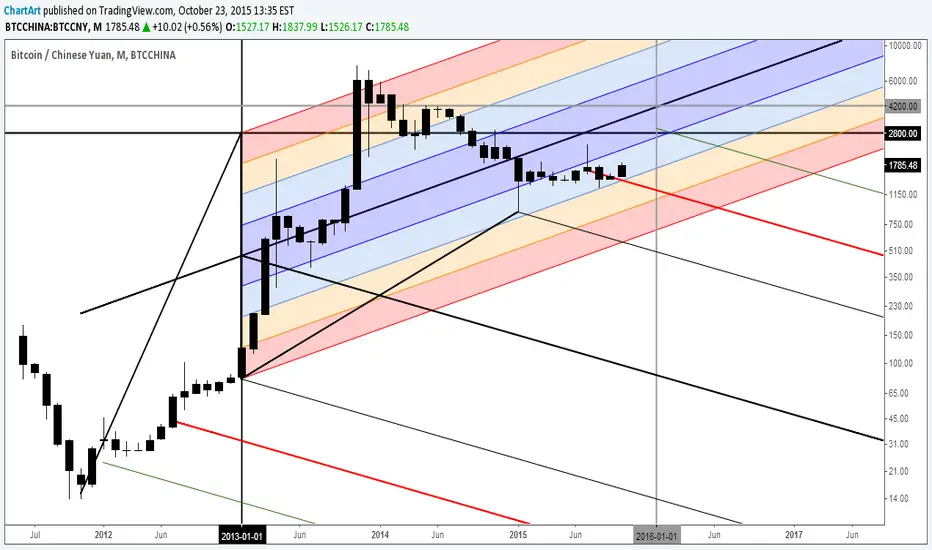
I discovered some interesting relationships that can be drawn as lines onto the Bitcoin monthly chart. It appears there is a older larger uptrend channel, in which the price is still in (blue channel).
Here is a zoomed-in screenshot of this chart:

P.S. An older bullish chart I made 3 months ago:

Here is a zoomed-in screenshot of this chart:
P.S. An older bullish chart I made 3 months ago:
免责声明
这些信息和出版物并不意味着也不构成TradingView提供或认可的金融、投资、交易或其它类型的建议或背书。请在使用条款阅读更多信息。