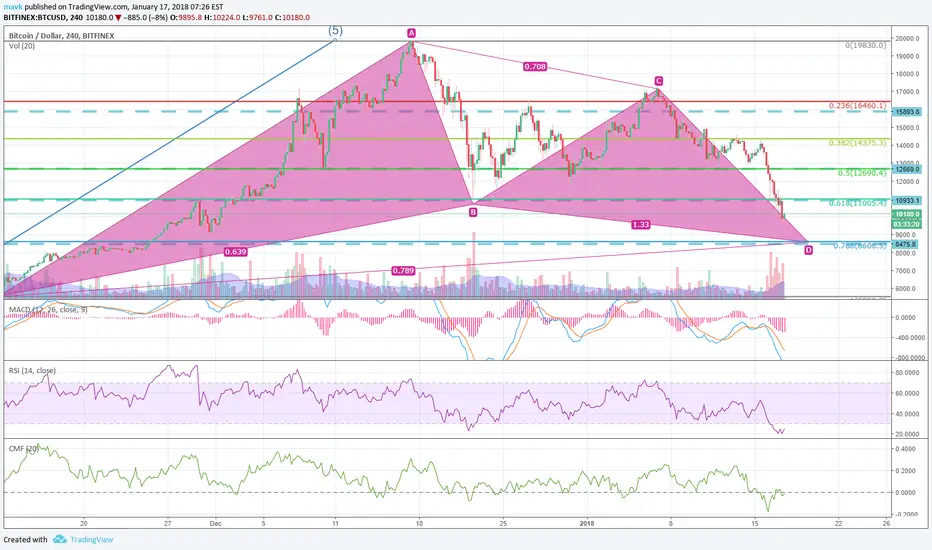
GARTLEY PATTERN coming to and and.
This here is a almost perfect example of Gartley's pattern, numbers which are specified for this pattern are almost 100% correct here!
Buy between 8600-11000..
Ps. RSI is extremely oversold on this 4h chart.
This here is a almost perfect example of Gartley's pattern, numbers which are specified for this pattern are almost 100% correct here!
Buy between 8600-11000..
Ps. RSI is extremely oversold on this 4h chart.
注释
MACD and RSI started showing divergence on 1hour candlesticks. Good sign as we are getting closer to the bottom support 8600. Dip is going to be over soon.注释
Quasimodo showing in 15min candles. Possible long entry!免责声明
这些信息和出版物并不意味着也不构成TradingView提供或认可的金融、投资、交易或其它类型的建议或背书。请在使用条款阅读更多信息。