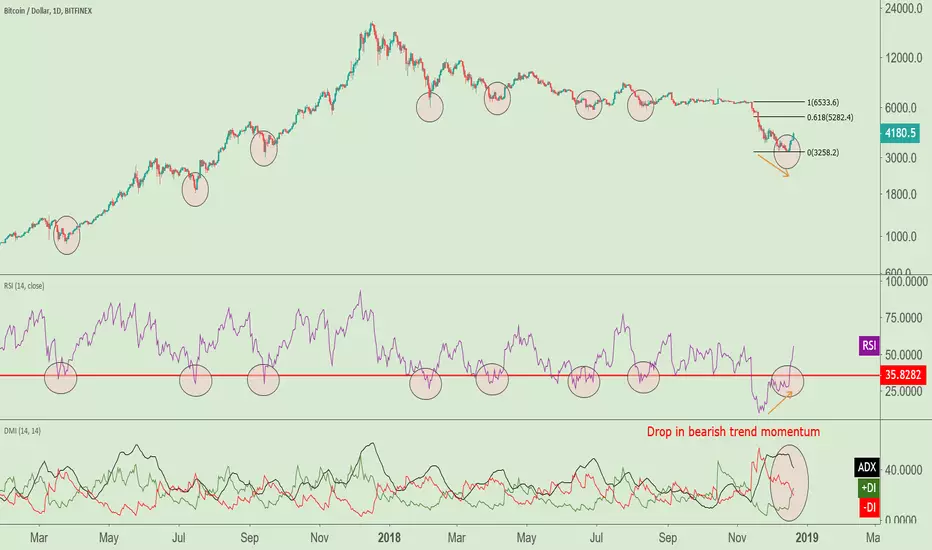
Been follow the RSI and the ADX to help signal a possible reversal and was looking for 3 signals to complete this validation.
1. Divergence between the price and the RSI. As price was making a new low the RSI was signaling less sellers making that low. This is a bullish signal.
2. But what about trend momentum? We want to see a weakening bearish trend and we got that with a falling ADX line and a falling negative directional index line.
3. A move out of oversold conditions. The RSI has push higher to exit the oversold zone.
Look back at history on the RSI and ADX.. when these two match the trend should reverse. I am looking for a move to the 61.8% Fibonacci level in the coming weeks.
Thoughts?
免责声明
这些信息和出版物并非旨在提供,也不构成TradingView提供或认可的任何形式的财务、投资、交易或其他类型的建议或推荐。请阅读使用条款了解更多信息。
免责声明
这些信息和出版物并非旨在提供,也不构成TradingView提供或认可的任何形式的财务、投资、交易或其他类型的建议或推荐。请阅读使用条款了解更多信息。