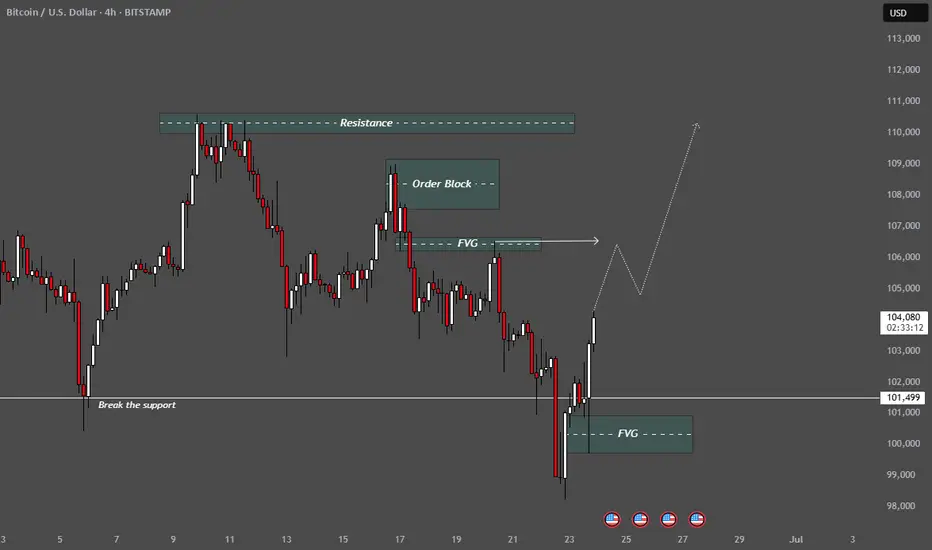
1. Support & Resistance Levels
Resistance Zone (highlighted at the top):
Around the 110,000–112,000 range.
Previous Support (horizontal line at 101,499):
Labelled as “Break the support” — price had broken below it but is now pushing back above.
📦
Smart Money Concepts (SMC):
2. Order Block (OB)
Marked near 105,000: A key supply area where institutional activity likely occurred. Price may react here (retest or rejection).
3. FVG (Fair Value Gaps)
Two zones marked as FVG:
Lower FVG around 100,000–101,000: recently filled and acted as support.
Upper FVG just above 105,000: potential target zone before price pushes higher.
📈
Projected Price Path:
The dotted white line shows a bullish forecast:
Price breaks back above the previous support.
Pulls back into the FVG or OB.
Then rallies toward 110,000+ resistance zone.
🧠
Interpretation:
This analysis suggests a bullish reversal scenario based on:
Liquidity grab below support,
FVG and OB structures,
Expectation of institutional buying and upward continuation.
免责声明
这些信息和出版物并不意味着也不构成TradingView提供或认可的金融、投资、交易或其它类型的建议或背书。请在使用条款阅读更多信息。
免责声明
这些信息和出版物并不意味着也不构成TradingView提供或认可的金融、投资、交易或其它类型的建议或背书。请在使用条款阅读更多信息。