Hello everyone !
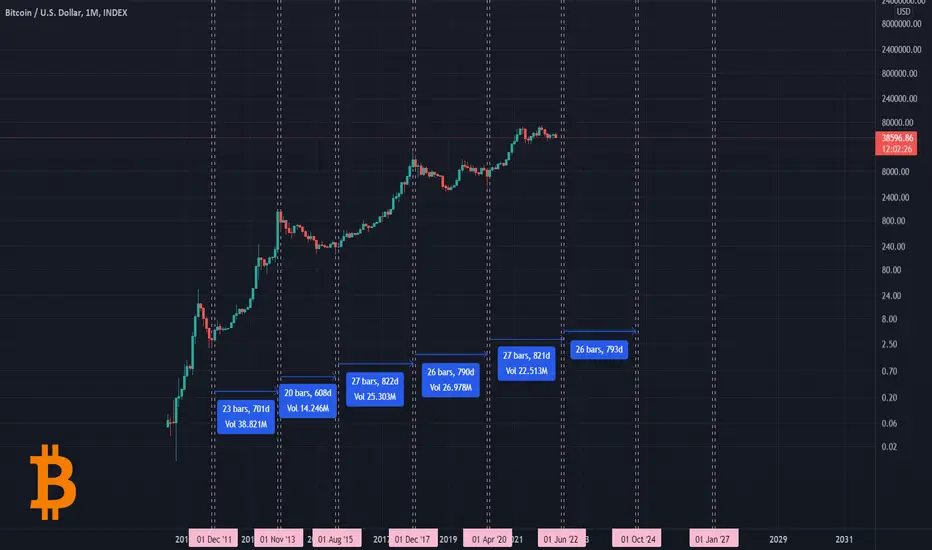
With this chart you can always know when the exact time for BTC and the whole crypto market to turn Bullish or Bearish in this repetitive cycle.
Each part consists of two lines, the first line to indicate the end of the current cycle and the second line to indicate the beginning of the new cycle.
The average is 748 Days for all cycles, And as you can see in terms of time market is too close to turn, So be aware of Bears!
----------------------------------------------------------------
Liked the idea?
Comment, Like, Follow ✌
免责声明
这些信息和出版物并不意味着也不构成TradingView提供或认可的金融、投资、交易或其它类型的建议或背书。请在使用条款阅读更多信息。