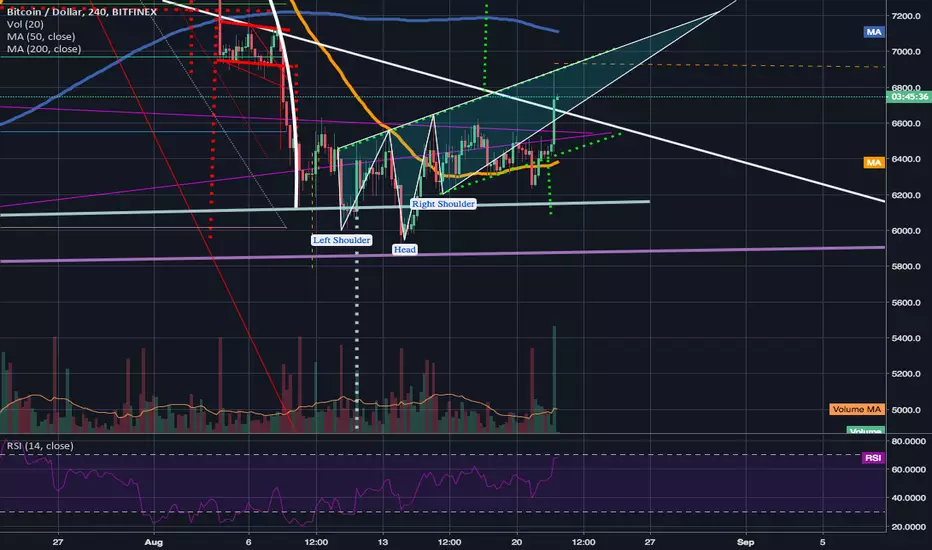
After one of the most massive bullish 4hr volume candles we've seen in a long while, We shot all the way back up to the neckline of the inverted head and shoulder pattern that never quite got invalidated but is now looking rather ugly. Had I been watching the charts when this bullish volume spike occured and saw the rejection I would have exited at the neckline as a very safe spot to then buy back in a few pips above it if it breaks out or accumulate a little more whenever it finds a resting place after getting rejected but I was unfortunately preoccupied with other things and wasn't watching the charts. Either way because of just how massive that volume candle is I have a feeling up will be the path we ultimately head. If this turns out not to be the case and we break down from here I will be prepared and may ladder out small portions but I am optimistic we will hopefully be heading up or sideways at least. The RSI on the 4hr seems to suggest we are reaching the overbought zone but I ahve yet to look at it on the 1 day chart.
注释
both the 1 day and the 1 week rsi I have now checked and both have plenty of room to continue to move upward. An encouraging sign.注释
the 1 week pattern is the descending triangle pattern that we did a fake breakout from in july...hopefully this time the breakout is legit but we won't know for at least 12 more days or an insane amount of bullish volume before that if it is a legit breakout 14.4k is the target: s3.amazonaws.com/tradingview/snapshots/z/zQ1X8Cxk.png免责声明
这些信息和出版物并不意味着也不构成TradingView提供或认可的金融、投资、交易或其它类型的建议或背书。请在使用条款阅读更多信息。
免责声明
这些信息和出版物并不意味着也不构成TradingView提供或认可的金融、投资、交易或其它类型的建议或背书。请在使用条款阅读更多信息。