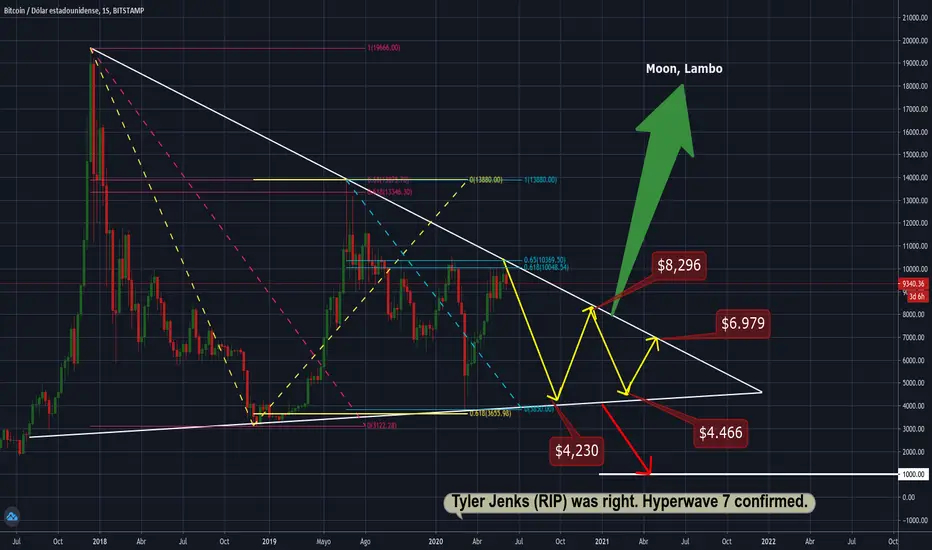
Using Fibonacci extensions and retracements (also the 0.65 golden zone) I attempt to see whether BTC breaks the pattern or just keeps inside this huge triangle.
Apparently BTC likes retrace to the 0.65 level then goes to the 0.618 retrace level projected from the previous swing. This pattern has been repeatedly seen since at least 2017.
This isn't a time based prediction intent, just price levels to take account.
Apparently BTC likes retrace to the 0.65 level then goes to the 0.618 retrace level projected from the previous swing. This pattern has been repeatedly seen since at least 2017.
This isn't a time based prediction intent, just price levels to take account.
免责声明
这些信息和出版物并非旨在提供,也不构成TradingView提供或认可的任何形式的财务、投资、交易或其他类型的建议或推荐。请阅读使用条款了解更多信息。