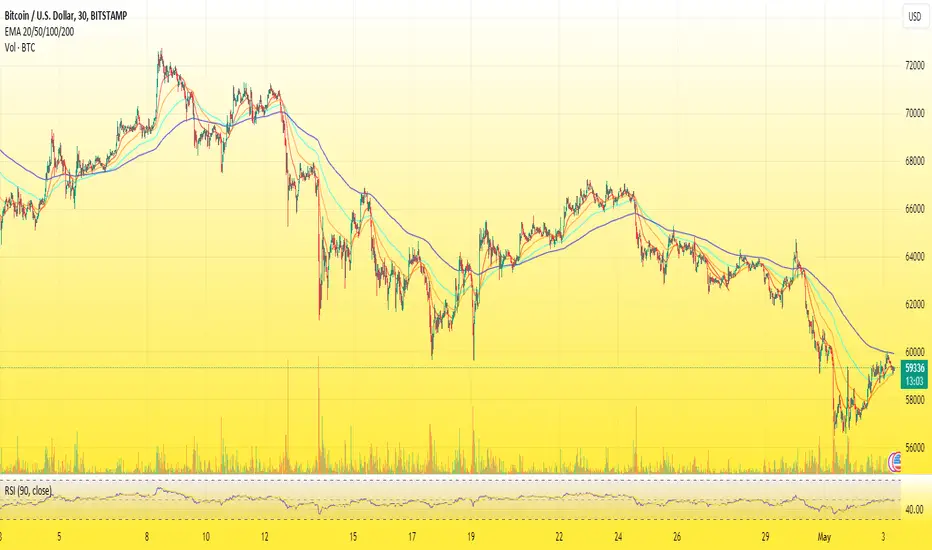
As we observe the BTC/USD chart on a 15-minute timeframe, several key indicators suggest a market poised for potential breakout:
- EMA Convergence: The EMA20 and EMA50 are closely aligned, indicating a consolidation phase. A breakout from this phase could set the direction for the next significant price movement.
- RSI Neutrality: The RSI stands at 52.57, reflecting a neutral market sentiment. Traders should watch for a break above 70 or below 30 to signal overbought or oversold conditions, respectively.
- Price Action: The recent decline followed by a partial recovery suggests a testing phase for the market. A sustained move above the recent high could confirm bullish momentum, while a drop below the recent low may signal further bearish pressure.
- Volume Analysis: While not visible in the chart description, volume will be a critical factor to confirm any breakout. An increase in volume during a price move indicates stronger conviction among traders.
- Potential Breakout Levels:
- Upside: Watch for a sustained move above the recent high at $59,586, which could open the path towards $60,000 psychological resistance.
- Downside: A break below the recent low at $59,583 may lead to a test of the $59,200 support zone.
Traders should keep an eye on these indicators and be prepared to act on confirmed breakout signals.
免责声明
这些信息和出版物并不意味着也不构成TradingView提供或认可的金融、投资、交易或其它类型的建议或背书。请在使用条款阅读更多信息。