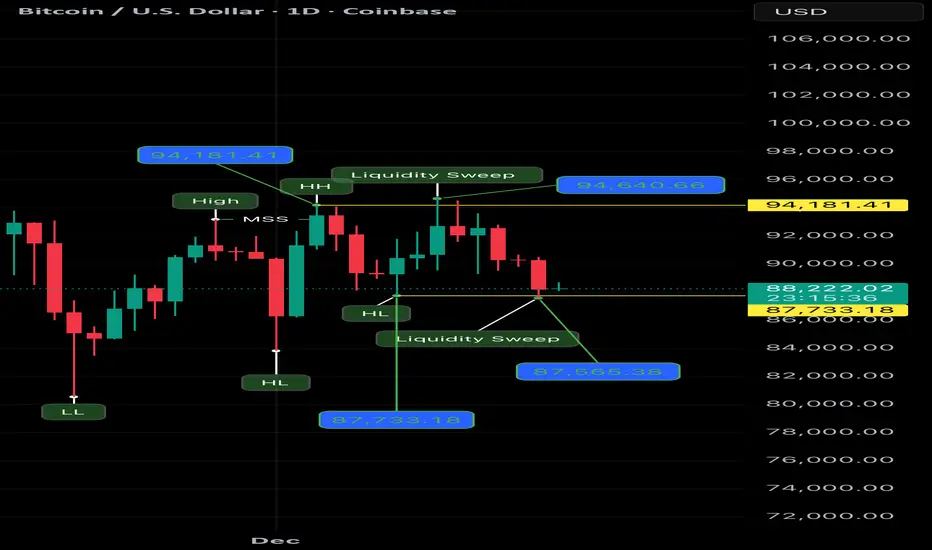
This daily Bitcoin chart shows a clear sequence of price behavior driven by liquidity interaction, not randomness.
Let’s go step by step.
⸻
1️⃣ Market Structure Shift (MSS)
Price breaks above a previous daily high, creating a temporary bullish shift in structure.
This move changes short-term bias and pulls attention to higher prices, but structure alone does not confirm continuation.
⸻
2️⃣ Higher High Formation
After the shift, price extends higher and prints a Higher High around 94,181 – 94,640.
This area becomes a natural reaction zone, where:
• Stops accumulate
• Breakout activity increases
• Participation expands
Price now has clear overhead liquidity.
⸻
3️⃣ Liquidity Sweep Above Highs
Price pushes above the highs with long upper wicks, taking liquidity, but fails to hold above the level.
Key observations:
• No sustained closes above highs
• Immediate rejection
• Weak follow-through
This indicates exhaustion, not strength.
⸻
4️⃣ Loss of Upward Momentum
Following the sweep, price struggles to progress higher and begins to rotate lower.
This signals that the move up completed its objective and that the market is no longer accepting higher prices.
⸻
5️⃣ Downside Rotation Toward Higher Lows
As price moves down, attention shifts to the daily Higher Lows (HLs) that supported the prior structure.
These lows represent protected liquidity beneath the market.
⸻
6️⃣ First Sell-Side Liquidity Sweep (≈ 87,733)
Price drops sharply and sweeps a daily Higher Low, triggering stops and accelerating movement.
This move is clean and direct, showing clear intent.
⸻
7️⃣ Second Sell-Side Liquidity Sweep (≈ 87,565)
A deeper wick follows, confirming:
• Downside liquidity was actively targeted
• The move was deliberate and measured
Multiple sweeps reinforce the idea of liquidity completion, not panic.
⸻
8️⃣ Current Price State
At the current level (~88,340):
• Liquidity has been taken on both sides
• Price is transitioning into a balance / evaluation phase
From here, the next move will depend on:
• Acceptance above the swept lows
• Or continuation below with new structure development
⸻
Final Takeaway
This chart demonstrates a pure cause-and-effect sequence:
✔️ Structure shift
✔️ Highs taken
✔️ Rejection
✔️ Lows taken
✔️ Reset
No assumptions.
No narratives.
Just price responding to liquidity.
Not a financial advice.
Ai Generated.
https://www.tradingview.com/x/nalwlVZi
免责声明
这些信息和出版物并非旨在提供,也不构成TradingView提供或认可的任何形式的财务、投资、交易或其他类型的建议或推荐。请阅读使用条款了解更多信息。
免责声明
这些信息和出版物并非旨在提供,也不构成TradingView提供或认可的任何形式的财务、投资、交易或其他类型的建议或推荐。请阅读使用条款了解更多信息。