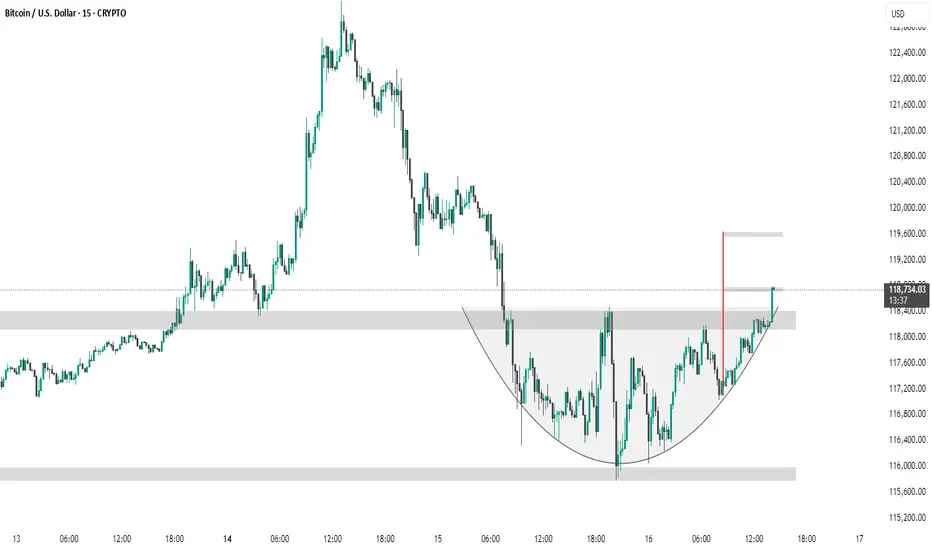
The chart shows a 15-minute BTC/USD timeframe forming a cup and handle pattern, a bullish continuation signal. Price has broken above the handle resistance zone (~$118,400), suggesting a potential breakout. The red vertical line marks the expected target, projecting a move toward the $119,600 level based on the pattern height.
免责声明
这些信息和出版物并不意味着也不构成TradingView提供或认可的金融、投资、交易或其它类型的建议或背书。请在使用条款阅读更多信息。