BITCOIN The Halving Triangle of $13000 which Bulls are targeting
Just something quick to came into my attention while I was comparing Bitcoin's 2014 - 2017 Cycle to the current one.
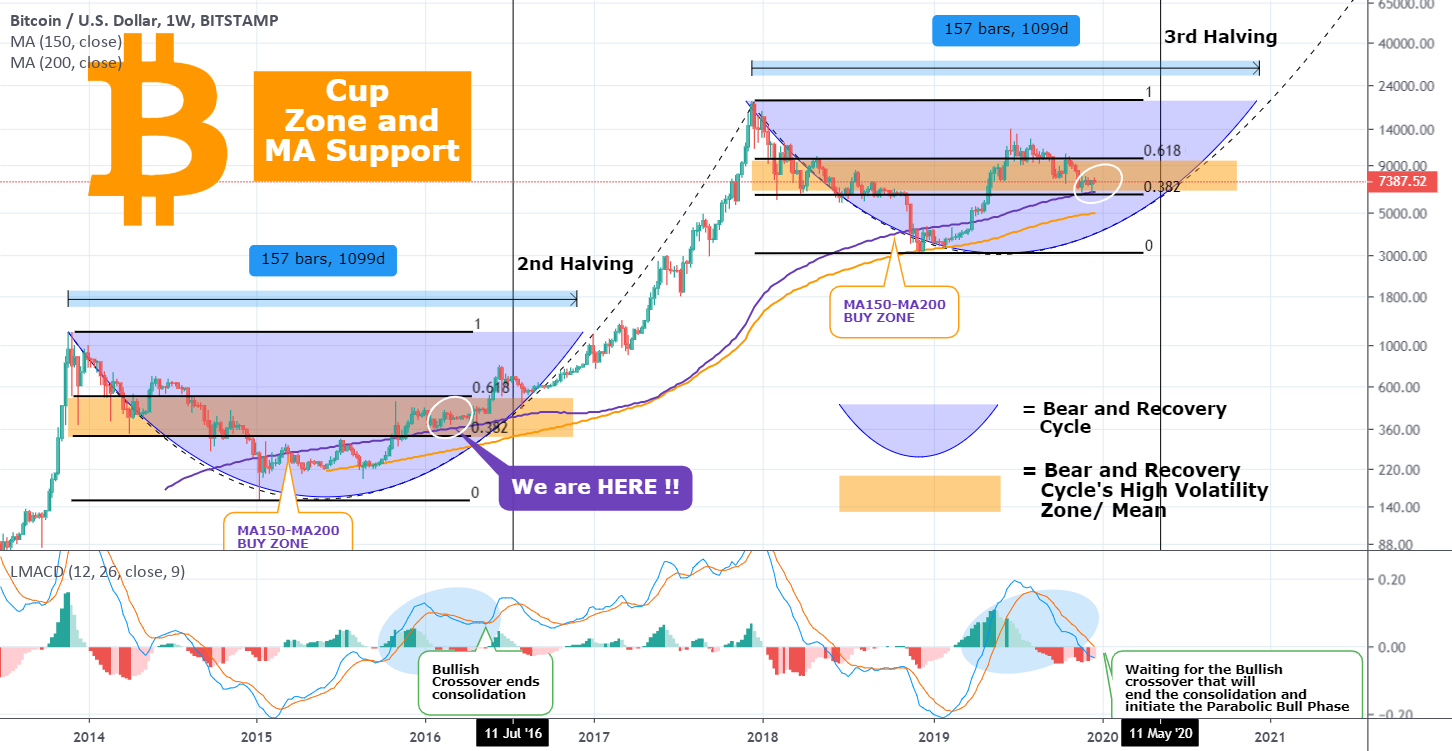
** The High Volatility Zone **
Initially I was looking into the High Volatility zone, which as you see on the chart is the orange Rectangle which is roughly within the 0.382 - 0.618 Fibonacci retracement level from top to bottom of the Cycle. That is the zone which during the Bear and Recovery phases held the price within its bands most of the time.
Before each Halving (2nd and 3rd) each top has been on the 0.786 Fibonacci retracement level: in 2016 that was a few weeks before the Halving, while on the current cycle it was during the Apri-June aggressive expansion. On both phases the 0.382 Fibonacci held as Support.
** The pre-Halving Triangle Zone **
Now, I have made my case why I believe that the bottom of June's correction is in, and as seen on this chart it is quite obvious why. The question is, since the 0.786 Fibonacci was achieved in 2016 right before the Halving, will Bitcoin make another touch this time around before the 3rd Halving? Or the June top was enough for marking the 0.786 level already?
As you see on the chart this area is just above the (2016) High Volatility Zone and is better displayed by a Triangle. On the current Cycle this Triangle is vacant. Will BTC fill the space and make a $13000 high? Let me know in the comments section!
Please like, subscribe and share your ideas and charts with the community!
P.S. Take a look at some similar material I've made on this matter:


👑Best Signals (Forex/Crypto+70% accuracy) & Account Management (+20% profit/month on 10k accounts)
💰Free Channel t.me/tradingshotglobal
🤵Contact info@tradingshot.com t.me/tradingshot
🔥New service: next X100 crypto GEMS!
💰Free Channel t.me/tradingshotglobal
🤵Contact info@tradingshot.com t.me/tradingshot
🔥New service: next X100 crypto GEMS!