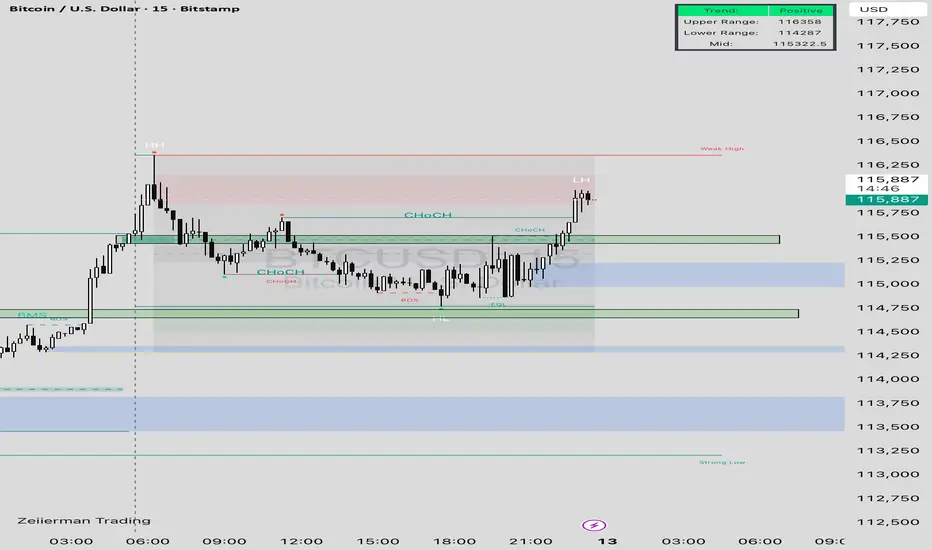
This 15-minute Bitcoin chart highlights a positive market trend with current price action at $115,896 (+0.31%). The structure shows a recent Change of Character (ChoCH) and Break of Structure (BOS), indicating bullish momentum after reclaiming support near 114,750. The price is testing the 116,000 resistance zone, marked by a weak high (HH) and lower high (LH) structure. Key levels are defined with:
• Upper Range: 116,358
• Lower Range: 114,287
• Midpoint: 115,322.5
The chart suggests possible liquidity grabs near the weak high and continuation toward the upper range if bullish momentum holds, while failure could retest demand zones around 115,000–114,750.
 BTCUSD
• Upper Range: 116,358
• Lower Range: 114,287
• Midpoint: 115,322.5
The chart suggests possible liquidity grabs near the weak high and continuation toward the upper range if bullish momentum holds, while failure could retest demand zones around 115,000–114,750.
免责声明
这些信息和出版物并不意味着也不构成TradingView提供或认可的金融、投资、交易或其它类型的建议或背书。请在使用条款阅读更多信息。
免责声明
这些信息和出版物并不意味着也不构成TradingView提供或认可的金融、投资、交易或其它类型的建议或背书。请在使用条款阅读更多信息。
