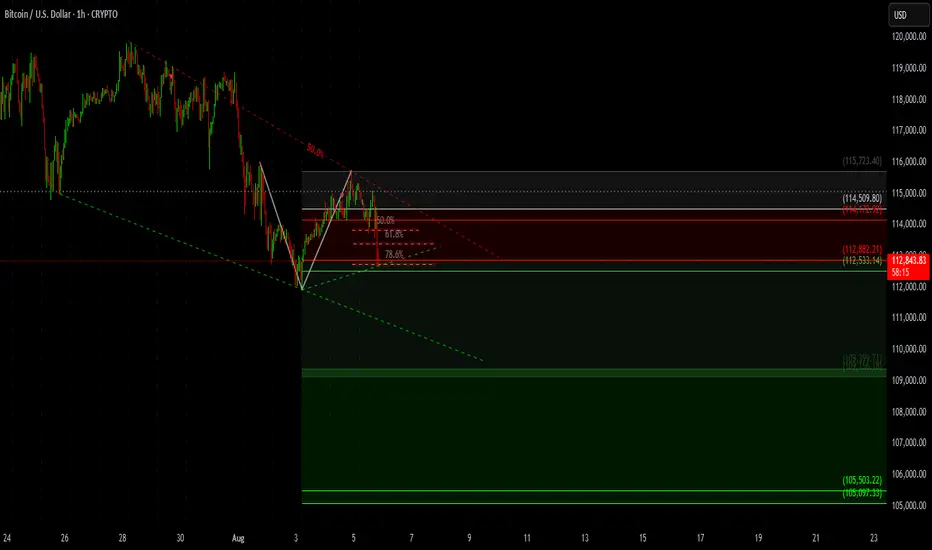
Bearish Pennant forming — price is consolidating within a descending triangle/pennant after a sharp drop, indicating a possible continuation.
🔺 Key Resistance Zones:
$114,509 – $114,742 (marked with dark red zone)
Fibonacci 50% – 61.8% levels aligning with this resistance zone
🔻 Support Zones:
$112,533 (current 78.6% fib retracement acting as intraday support)
$109,320 – $108,720 (potential bounce zone)
$105,503 – $105,097 (final bearish target if breakdown continues)
📐 Fibonacci Retracement Levels
Price retraced to 50%–61.8% and is now testing lower levels.
Breakdown from this region confirms bearish pressure.
📈 Bias: Bearish below $113,000
📉 Next Potential Target:
Short-term: $109,300
Medium-term: $105,000
💬 Conclusion: BTC is showing weakness after a failed breakout and rejection from fib resistance. If $112,500 breaks, expect acceleration toward $109K and possibly $105K.
免责声明
这些信息和出版物并不意味着也不构成TradingView提供或认可的金融、投资、交易或其它类型的建议或背书。请在使用条款阅读更多信息。
免责声明
这些信息和出版物并不意味着也不构成TradingView提供或认可的金融、投资、交易或其它类型的建议或背书。请在使用条款阅读更多信息。