https://www.tradingview.com/x/jnonE733/
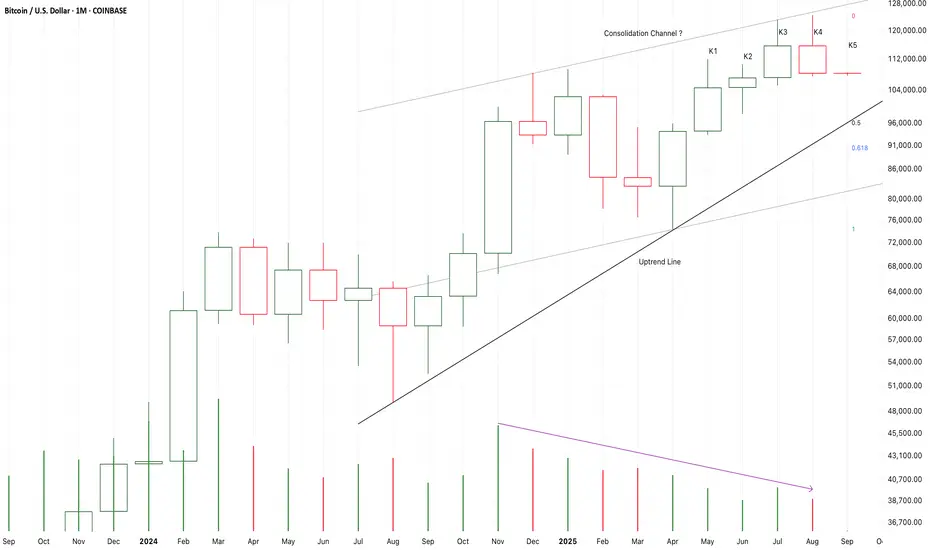
After K3 break up the previous higher high,
K4 return back immediately.
It seems that K3 was a potential fake up candle,
But it must be verified by K5.
I am expecting a doji candle of K5 close at low price area to terminate the three years bull market here.
If I bought it earlier,
I will try to cut off most of my long-term positions and even try to buy MSTZ to short it.
On the other hand,
If K5 close at high price,
The following candles will test 128K area or even break up it.
Long-88K/Target-98K/Stop-87K
Short-115K/Target-89K/Stop-116K
注释
From K1 to K3,
It is a strong three soldiers advancing pattern under increasing supply pressure.
It break down the support.
But the overall supply pressure keeps at low level,
Perhaps it is not a valid break down.
It must be verified by K4.
If K4 still close below the support,
The risk will increase.
The long-term uptrend will be terminated here.
If K4 close upon K3,
It is still possible that the following candles will return back to test 123K area.
Long-88K/Target-98K/Stop-87K
Short-115K/Target-89K/Stop-116K
注释
From K3 to K5,
It is a bullish morning star pattern.
It verified a potential support,
And also, it verified a fake down of K3.
So, it is likely that the long-term bull market still control the situation.
At the same time,
After K5 close upon the bear gap of K3,
K6 return back immediately.
It seems that the short-term consolidation trend still have an impact to the market here.
So, I am excepting a doji candle of K7 or K8 to test the support for a third time,
And then, another bull run will start here to test 123K again.
Long-111888/Target-121K/Stop-110K
Short-123K/Target-99K/Stop-124K
注释
K4 close at high price area under increased demands,
It verified a potential support,
If K5 test the support for a second time and still close at high price area,
It will be a good place to buy it at 108K,
And another bull run will start here to test 124K area.
On the other hand,
K2 to K4 is a potential bearish evening star pattern.
It verified a downtrend line here.
If K5 break down the support under increasing supply pressure,
Another bear run will start here to test 93K.
注释
I was expecting a doji candle of K6,
But unfortunately, I was wrong.
It seem that the long-term uptrend line is still effective here.
It is likely that K7 will keep pricing up to test 120K area.
If K7 is a doji candle close at low price area and couldn’t lose upon the uptrend line,
It is still possible that the three years bull market will be terminated by K7.
And, I will still try to short it at K7.
免责声明
这些信息和出版物并不意味着也不构成TradingView提供或认可的金融、投资、交易或其它类型的建议或背书。请在使用条款阅读更多信息。
免责声明
这些信息和出版物并不意味着也不构成TradingView提供或认可的金融、投资、交易或其它类型的建议或背书。请在使用条款阅读更多信息。