🟣 BTCUSDT – Regression Channel Breakout Before the Next Drop
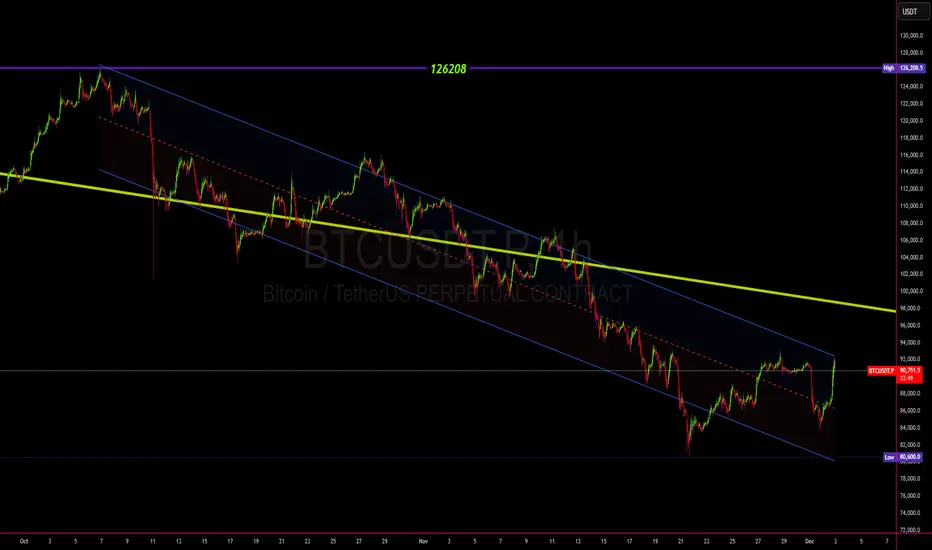
Since October 6th, Bitcoin has been moving inside a downward regression channel.
Recently, the price touched the upper boundary of the channel, signaling a possible end of the current correction phase.
📈 A short-term bounce toward the $94,000 level is still possible,
but afterwards, Bitcoin is likely to start its next bearish wave targeting the $75,000 zone.
🔸 Key Resistance: $94,000
🔹 Key Target Zone: $75,000
Mid-term trend remains bearish as BTC prepares for another downward leg.
📘 What is a Regression Channel and Why It Matters?
A regression channel is a powerful analytical tool that automatically combines what many indicators try to show individually — such as trend strength, momentum shifts, and volatility ranges.
It’s built using linear regression, which means it mathematically calculates the “average path” of price movement, along with upper and lower boundaries that represent standard deviations from that average.
In simple terms:
➡️ It already reflects what tools like MACD, RSI, and moving averages are trying to capture — but in a single, visual, and statistically balanced structure.
That’s why breaking out of a regression channel often signals a major shift in trend direction or volatility expansion.
相关出版物
免责声明
这些信息和出版物并非旨在提供,也不构成TradingView提供或认可的任何形式的财务、投资、交易或其他类型的建议或推荐。请阅读使用条款了解更多信息。