Price Action Analysis (Daily & Intraday)
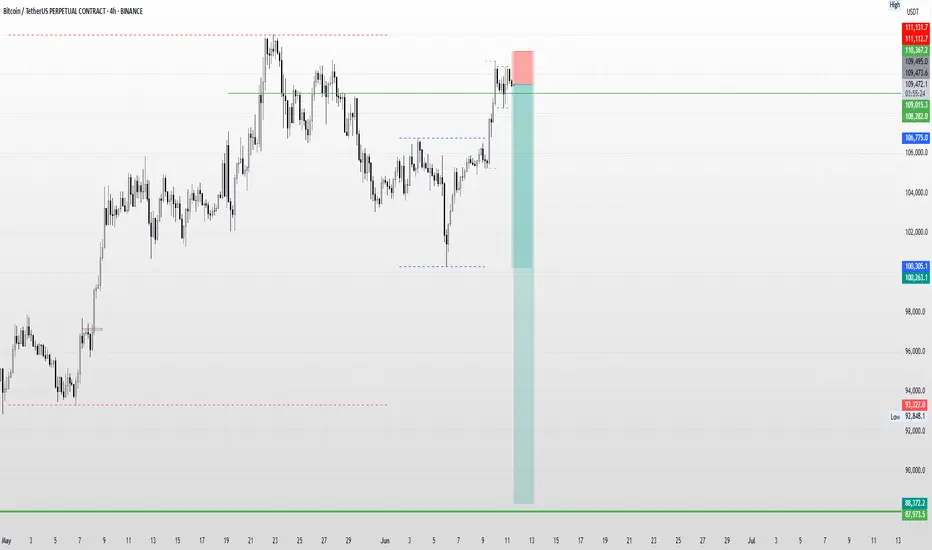
A bearish pattern has formed on the Daily Timeframe, and early signs of execution are visible on the 1-hour chart, indicating a potential Double Top formation. If confirmed, the price may drop with an initial target around 100263. Should the bearish momentum continue, the next significant weekly support could be tested near 88372.
Caution:
This setup is considered risky, primarily because the higher timeframe (Monthly) still shows an overall uptrend. However, with a well-defined stop-loss above 16367 and proper risk management, the trade could offer a favorable risk-to-reward ratio.
Disclaimer:
Trading, especially in futures and options, involves a high degree of risk. Losses can exceed capital if not managed properly. This is not financial advice. Please do your own analysis or consult a certified financial advisor before making any investment decisions.
免责声明
这些信息和出版物并非旨在提供,也不构成TradingView提供或认可的任何形式的财务、投资、交易或其他类型的建议或推荐。请阅读使用条款了解更多信息。
免责声明
这些信息和出版物并非旨在提供,也不构成TradingView提供或认可的任何形式的财务、投资、交易或其他类型的建议或推荐。请阅读使用条款了解更多信息。