Chart analysis for Bitcoin.
A view of Bitcoin, focusing on key technical levels and market structure:
Trend and Price Activity
Downtrend Confirmation:
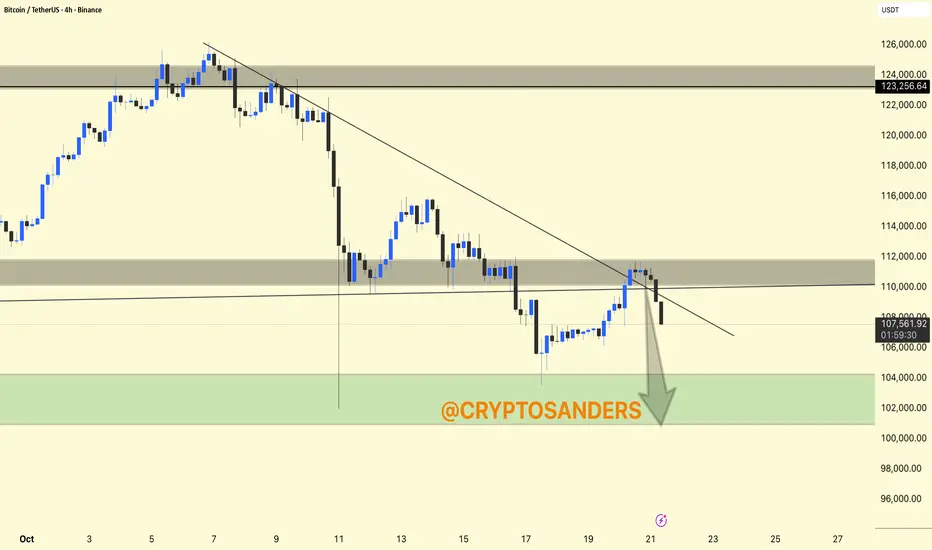
The price is clearly following a descending trendline. Attempts to break this line near the $111,000-$112,000 resistance level have failed.
Resistance Zone:
The gray area around $111,000-$112,000 represents a supply zone where the price struggled and faced selling pressure.
A very high resistance band exists near $123,000-$124,000 (upper chart), but the price is still well below this level.
Support Zone:
The large green box at $102,000-$106,000 marks a key demand zone, indicating where buyers could step in for a potential reversal or bounce.
DYOR | NFA
A view of Bitcoin, focusing on key technical levels and market structure:
Trend and Price Activity
Downtrend Confirmation:
The price is clearly following a descending trendline. Attempts to break this line near the $111,000-$112,000 resistance level have failed.
Resistance Zone:
The gray area around $111,000-$112,000 represents a supply zone where the price struggled and faced selling pressure.
A very high resistance band exists near $123,000-$124,000 (upper chart), but the price is still well below this level.
Support Zone:
The large green box at $102,000-$106,000 marks a key demand zone, indicating where buyers could step in for a potential reversal or bounce.
DYOR | NFA
相关出版物
免责声明
这些信息和出版物并非旨在提供,也不构成TradingView提供或认可的任何形式的财务、投资、交易或其他类型的建议或推荐。请阅读使用条款了解更多信息。