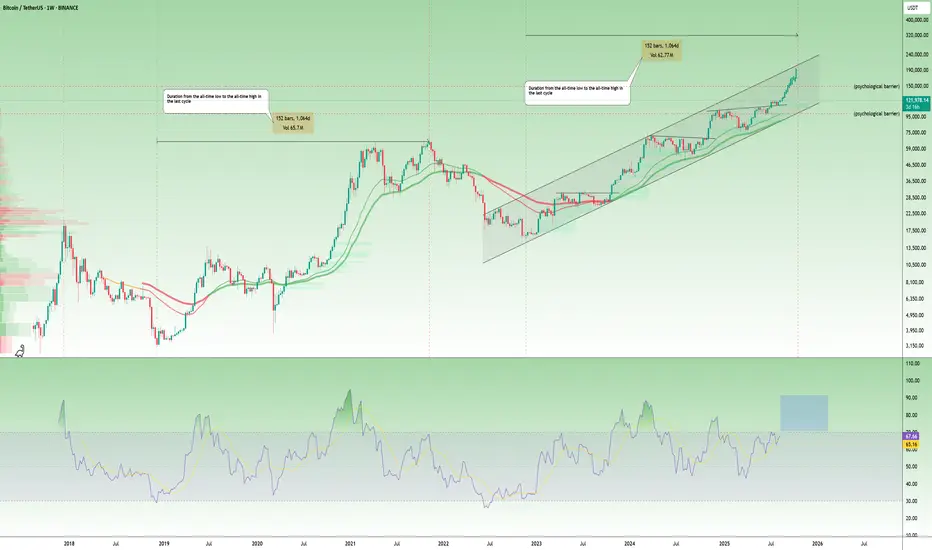
In the last cycle, it took Bitcoin 1,044 days to move from the bear market bottom to a new all-time high. This cycle is on the same timeline, and we’re now well into that phase.
Price is staying inside the long-term rising channel, and momentum is building. If this continues, a macro top could form between late October and early November, maybe even by the first week of October if the rally speeds up.
The RSI is also climbing toward the same overbought levels seen before past tops. The cycle pattern isn’t random.
It’s the guide.
交易开始
A fakeout above the $123K ATH was met with a sharp rejection, sending the price back below the breakout zone.
$120K is now the key pivot, hold here, and bulls may attempt another run.
If we lose it, $114K–$115K support zone comes into play.
The trend remains bullish overall, but short-term momentum has cooled.
Resistance: $123.2K
Support: $120K and $114.2K
keep an eyes on daily candle close.
注释
#BITCOIN Weekly Chart
#Bitcoin printed a new all-time high (ATH) at $124,750, briefly surpassing the previous peak of $123,250. However, the breakout quickly stalled, showing signs of a fakeout as profit-taking pressure emerged near the highs.
⚠️ Failure to hold above the $123K–$125K zone could confirm a rejection and trigger a deeper pullback. Only sustained consolidation above $125K would validate a continuation higher.
Register on Blofin, Toobit and BingX and trade with me: 👇
toobit.com/t/CryptoMojo
partner.blofin.com/d/Cryptomojo
bingx.com/invite/WKCI5X/
Free TG Daily Futures Signals: 👉 t.me/CRYPTOMOJO_TA
toobit.com/t/CryptoMojo
partner.blofin.com/d/Cryptomojo
bingx.com/invite/WKCI5X/
Free TG Daily Futures Signals: 👉 t.me/CRYPTOMOJO_TA
免责声明
这些信息和出版物并不意味着也不构成TradingView提供或认可的金融、投资、交易或其它类型的建议或背书。请在使用条款阅读更多信息。