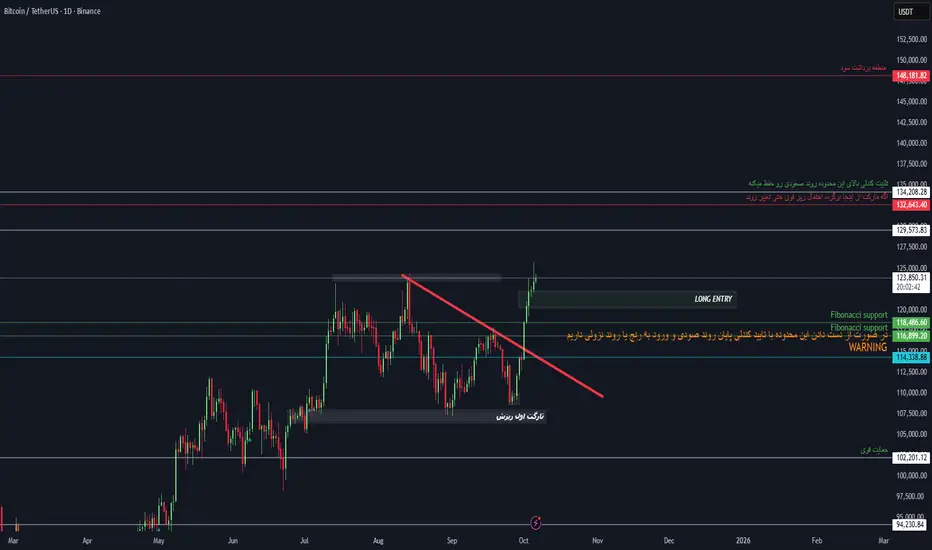
This weekly BTC/USDT chart highlights major Fibonacci support zones and the critical demand levels that have kept Bitcoin’s structure intact during recent corrections.
The chart shows how price reacted strongly to the Fibonacci confluence area around $116K–$118K, confirming it as a powerful support base. The breakout above the local downtrend line signals renewed bullish momentum, with targets at $129K and $132K — where a historical resistance cluster may trigger profit-taking.
Key notes from the chart:
Strong Support Zones: $114K–$118K area marked by Fibonacci and previous demand reaction.
Main Resistance Levels: $129K–$132K region — potential new all-time high zone.
Trend Observation: Price broke the short-term descending resistance line, showing buyers’ dominance returning.
Strong Base: Weekly structure remains bullish as long as $114K holds.
📈 “Respect the zones, follow the structure.”
#BTC #Bitcoin #CryptoAnalysis #TradingView #TechnicalAnalysis #TradeWithMky #Miracle #miracleshot
免责声明
这些信息和出版物并不意味着也不构成TradingView提供或认可的金融、投资、交易或其它类型的建议或背书。请在使用条款阅读更多信息。
免责声明
这些信息和出版物并不意味着也不构成TradingView提供或认可的金融、投资、交易或其它类型的建议或背书。请在使用条款阅读更多信息。