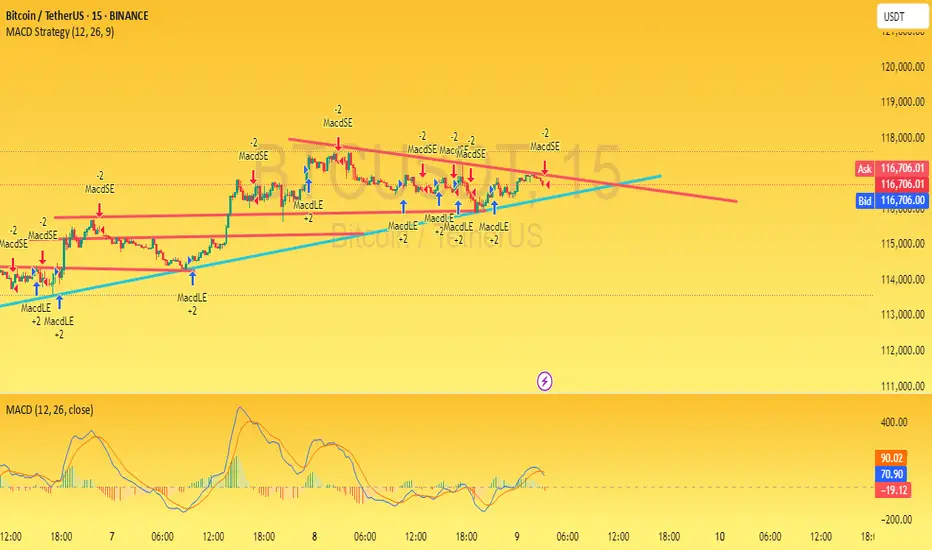
In the 15-minute chart of BTCUSDT, the price is currently approaching a significant resistance level. Based on the MACD indicator, bullish momentum is gradually building up, which may lead to a breakout above this resistance. If the breakout occurs with strong volume, the price is likely to move higher, potentially opening the way for short-term bullish opportunities.
However, if the price fails to break above this level and faces rejection, it could signal a shift in market sentiment, leading to a potential downside move. In such a case, we might see the market testing lower support levels in the short term.
Traders should monitor the breakout zone closely and wait for confirmation before entering a position. Managing risk with a proper stop-loss is essential given the volatility on lower timeframes.
免责声明
这些信息和出版物并不意味着也不构成TradingView提供或认可的金融、投资、交易或其它类型的建议或背书。请在使用条款阅读更多信息。