The Relative Strength Index (RSI) is a simple yet effective indicator, especially when it doesn't follow the market. This situation is called Divergence.
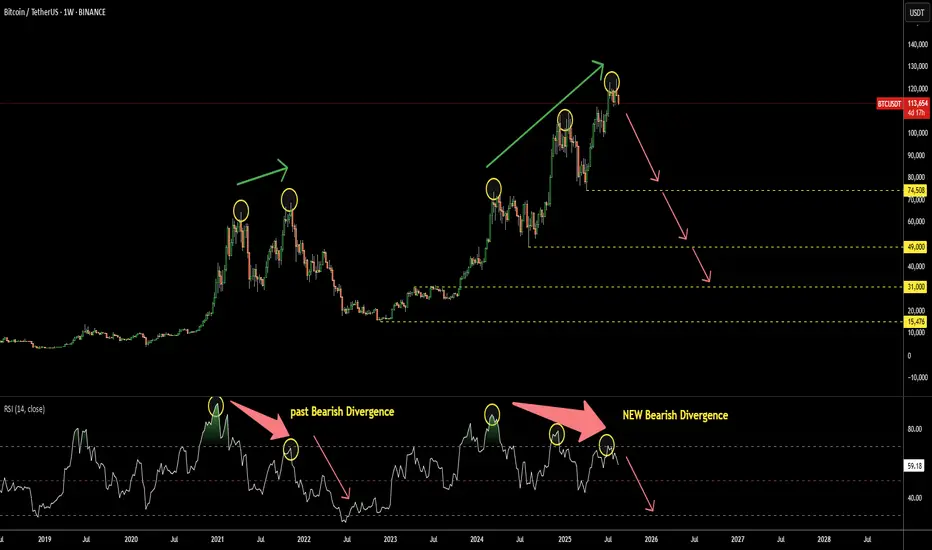
It has recently appeared on the Bitcoin chart as Bearish Divergence. This occurs when the market price makes a new peak, but the RSI, on the contrary, forms lower highs.
Looking back at the same chart, we can rewind to 2021, where a similar Bearish Divergence played out, pushing Bitcoin’s price down heavily from $69k to $15k.
This time, the Bearish Divergence on RSI is more pronounced, as it consists of 3 ascending peaks on the price chart, contrasted with 3 falling tops on the RSI sub-chart.
There are 4 key supports that could underpin the anticipated crash:
1) $74.5k - This year’s bottom
2) $49k - Consolidation low in 2024
3) $31k - Consolidation top in 2023
4) $15.5k - 2022 minimum
Where do you think the crash will stop?
免责声明
这些信息和出版物并不意味着也不构成TradingView提供或认可的金融、投资、交易或其它类型的建议或背书。请在使用条款阅读更多信息。