https://www.tradingview.com/x/B0S4fLIx
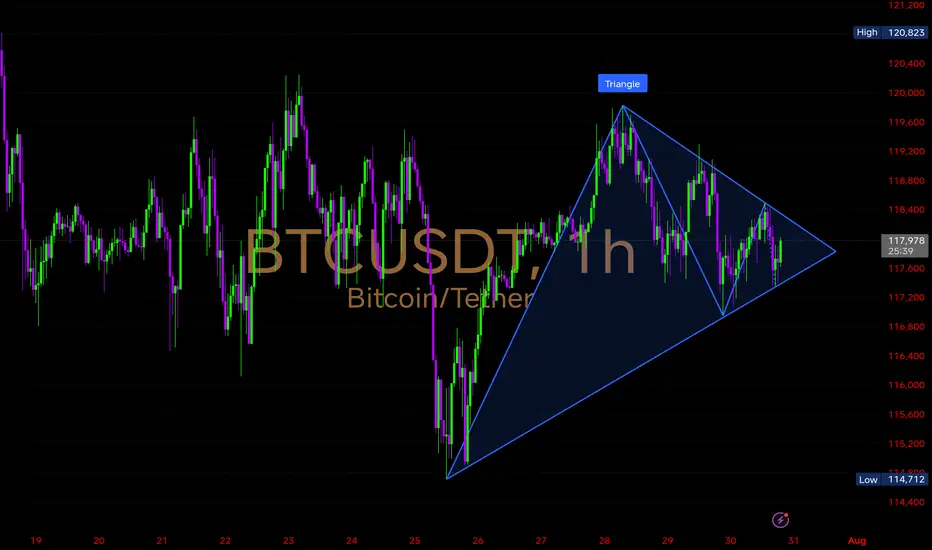
Bitcoin is compressing inside a well-defined symmetrical triangle on the 1-hour chart — a classic volatility squeeze setup🔺
• Triangle range: ~$120,800 (high) → $114,700 (low)
• Current price: ~$117,800
• Price nearing apex – breakout likely imminent within next few candles
• Lower highs + higher lows = indecision building
Probable Scenarios
🔹 Bullish Breakout
• Price must reclaim $118,500–$119,000 with strong volume
• Breakout above triangle top can lead to $120,800 retest
• Continuation supported by broader bullish structure
🔹 Bearish Breakdown
• Watch for clean rejection near $118,500 followed by a break below $117,000
• Losing the triangle bottom may open up $116,000 → $114,700 zone
Support: $117,000 / $116,000 / $114,700
Resistance: $118,500 / $120,000
🔁 Confirmation Needed:
• Watch for breakout + volume surge
• Sideways chop likely if price stays trapped
免责声明
这些信息和出版物并非旨在提供,也不构成TradingView提供或认可的任何形式的财务、投资、交易或其他类型的建议或推荐。请阅读使用条款了解更多信息。
免责声明
这些信息和出版物并非旨在提供,也不构成TradingView提供或认可的任何形式的财务、投资、交易或其他类型的建议或推荐。请阅读使用条款了解更多信息。