There are multiple support levels on the way down, so a bounce could happen at any of them. Ideally, this scenario gets invalidated with a strong rebound from $112K. Otherwise, the correction may drag on for weeks until a solid bottom is found.
The RSI is oversold on the 2H, but on the 1W timeframe,
⚠️ If the weekly bearish trend confirms, we could be facing several months of downside.
Will this trigger the start of alt season, or will altcoins get crushed even harder? Nobody can say for sure—so stay cautious and don’t get trapped by FOMO.
Here is the 1W chart, which is scary to be honest.
交易结束:到达目标
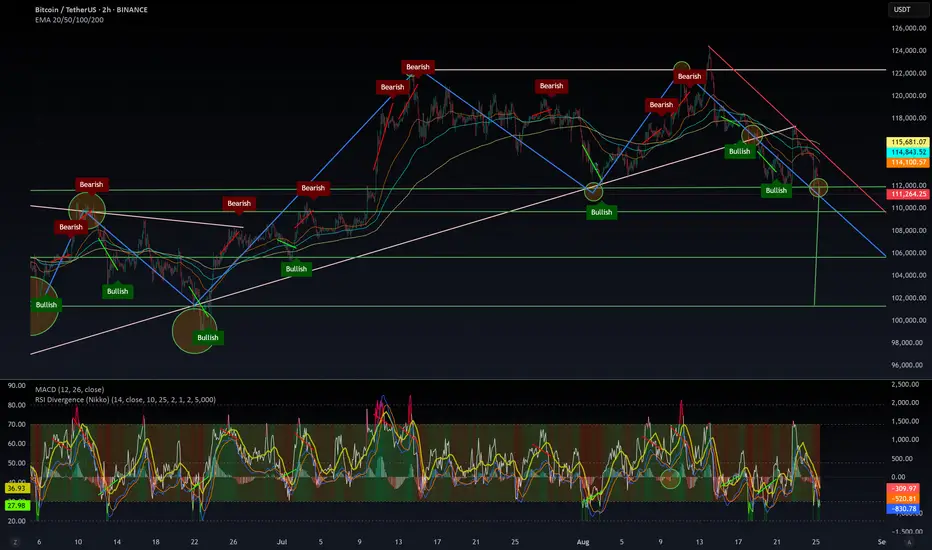
On the 2H timeframe, we’ve likely touched a local bottom around $107K. Market makers are aware that we’re still in a weekly (1W) bearish trend, and it looks like they want to push price up toward $117K — taking out shorts and closing the CME gap — before another dump plays out.I still expect
This idea was short-term only, so I’m closing it here. A new setup will be posted if something significant develops.
Telegram: t.me/metaisland_gg
Twitter X: x.com/cryptonikkoid
Web: nikkoid.com
I do not answer to private messages. Use the comment section of the idea or script, or use Telegram.
Twitter X: x.com/cryptonikkoid
Web: nikkoid.com
I do not answer to private messages. Use the comment section of the idea or script, or use Telegram.
免责声明
这些信息和出版物并不意味着也不构成TradingView提供或认可的金融、投资、交易或其它类型的建议或背书。请在使用条款阅读更多信息。