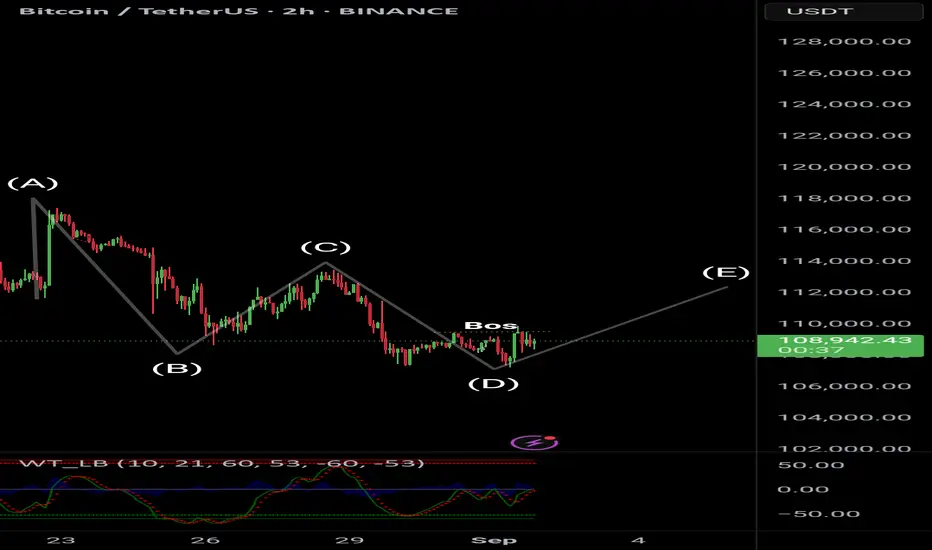
BTC/USDT – Elliott Wave Structure with BOS Confirmation
On the 2H timeframe, Bitcoin is showing a clear Elliott Wave corrective pattern:
Wave A → B → C → D completed
BOS (Break of Structure) confirms a potential shift towards a bullish reversal.
Price is consolidating near the $108,800 level, preparing for a possible move towards the Wave E target zone.
Key Observations:
Momentum indicators showing a potential bullish divergence.
Holding above the $108,000 support zone strengthens the bullish outlook.
Next resistance levels are at $110,000 – $112,000.
Trade Idea:
Entry: Around $108,800 (confirmation on bullish candle close)
Target Levels:
TP1: $110,500
TP2: $112,000
Stop Loss: Below $107,500 to manage risk.
Bias: Bullish as long as price sustains above the recent Wave D low.
Would you like me to include Fibonacci retracement levels in this description for more technical depth?
ChatGPT can make mistakes. Check important info. See Cookie
免责声明
这些信息和出版物并非旨在提供,也不构成TradingView提供或认可的任何形式的财务、投资、交易或其他类型的建议或推荐。请阅读使用条款了解更多信息。
免责声明
这些信息和出版物并非旨在提供,也不构成TradingView提供或认可的任何形式的财务、投资、交易或其他类型的建议或推荐。请阅读使用条款了解更多信息。